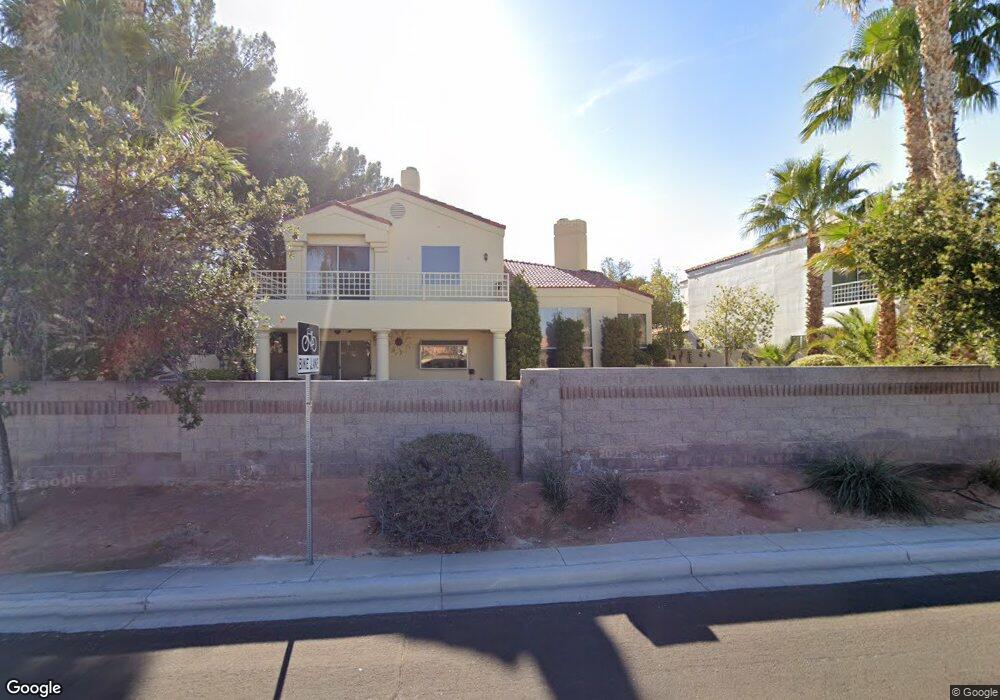
2105 Inverness Dr Unit 1 Henderson, NV 89074
Green Valley North NeighborhoodEstimated Value: $625,511 - $819,000
4
Beds
2
Baths
2,200
Sq Ft
$321/Sq Ft
Est. Value
About This Home
This home is located at 2105 Inverness Dr Unit 1, Henderson, NV 89074 and is currently estimated at $705,878, approximately $320 per square foot. 2105 Inverness Dr Unit 1 is a home located in Clark County with nearby schools including James Gibson Elementary School, Barbara and Hank Greenspun Junior High School, and Green Valley High School.
Ownership History
Date
Name
Owned For
Owner Type
Purchase Details
Closed on
Jan 20, 2011
Sold by
Duffy Michele A and Duffy Rexroat T
Bought by
Line Michael and Line Cindy
Current Estimated Value
Purchase Details
Closed on
Jan 27, 2003
Sold by
Sanders David F and Sanders Sharron S
Bought by
Duffy Rexroat T and Duffy Michele A
Home Financials for this Owner
Home Financials are based on the most recent Mortgage that was taken out on this home.
Original Mortgage
$234,400
Interest Rate
5.97%
Purchase Details
Closed on
Sep 17, 1996
Sold by
Catapano Joseph G and Catapano Sandra J
Bought by
Sanders David F and Sanders Sharron S
Home Financials for this Owner
Home Financials are based on the most recent Mortgage that was taken out on this home.
Original Mortgage
$172,000
Interest Rate
7.91%
Create a Home Valuation Report for This Property
The Home Valuation Report is an in-depth analysis detailing your home's value as well as a comparison with similar homes in the area
Home Values in the Area
Average Home Value in this Area
Purchase History
| Date | Buyer | Sale Price | Title Company |
|---|---|---|---|
| Line Michael | $275,500 | North American Title Sunset | |
| Duffy Rexroat T | $265,000 | National Title Company | |
| Sanders David F | $215,000 | United Title |
Source: Public Records
Mortgage History
| Date | Status | Borrower | Loan Amount |
|---|---|---|---|
| Previous Owner | Duffy Rexroat T | $234,400 | |
| Previous Owner | Sanders David F | $172,000 |
Source: Public Records
Tax History Compared to Growth
Tax History
| Year | Tax Paid | Tax Assessment Tax Assessment Total Assessment is a certain percentage of the fair market value that is determined by local assessors to be the total taxable value of land and additions on the property. | Land | Improvement |
|---|---|---|---|---|
| 2025 | $3,727 | $133,321 | $58,800 | $74,521 |
| 2024 | $3,451 | $133,321 | $58,800 | $74,521 |
| 2023 | $3,451 | $128,424 | $57,050 | $71,374 |
| 2022 | $3,196 | $112,352 | $46,200 | $66,152 |
| 2021 | $2,959 | $104,828 | $41,650 | $63,178 |
| 2020 | $2,745 | $104,396 | $41,300 | $63,096 |
| 2019 | $2,573 | $94,709 | $32,200 | $62,509 |
| 2018 | $2,455 | $91,940 | $31,150 | $60,790 |
| 2017 | $2,703 | $93,242 | $31,150 | $62,092 |
| 2016 | $2,298 | $90,147 | $27,650 | $62,497 |
| 2015 | $2,293 | $83,001 | $21,000 | $62,001 |
| 2014 | $2,222 | $74,419 | $21,000 | $53,419 |
Source: Public Records
Map
Nearby Homes
- 259 Spring Hills Ln
- 231 Windsong Dr
- 272 Grand Teton Dr
- 2108 Running River Rd
- 1939 Guinn Dr
- 2246 Cassatt Dr
- 2251 Van Gogh Dr
- 2250 Cassatt Dr
- 346 Pinnacle Ct
- 310 Pissarro Place
- 2239 Chatsworth Ct
- 371 Legacy Dr
- 2021 Angel Falls Dr
- 179 Adomeit Dr
- 1952 Barranca Dr
- 2284 Cassatt Dr
- 314 Lindbrook St
- 1926 Navarre Ln
- 372 Rushing Creek Ct
- 347 Gana Ct Unit B
- 2103 Inverness Dr
- 2109 Inverness Dr
- 2101 Inverness Dr
- 2061 Sutton Way
- 232 Pintale Cir
- 2106 Inverness Dr
- 2108 Inverness Dr
- 2102 Inverness Dr
- 2111 Inverness Dr Unit 1
- 2063 Sutton Way
- 2110 Inverness Dr
- 2100 Inverness Dr
- 234 Pintale Cir
- 2113 Inverness Dr
- 2112 Inverness Dr
- 2056 Sutton Way Unit 1
- 2054 Sutton Way
- 2058 Sutton Way
- 2067 Sutton Way
- 235 Pintale Cir