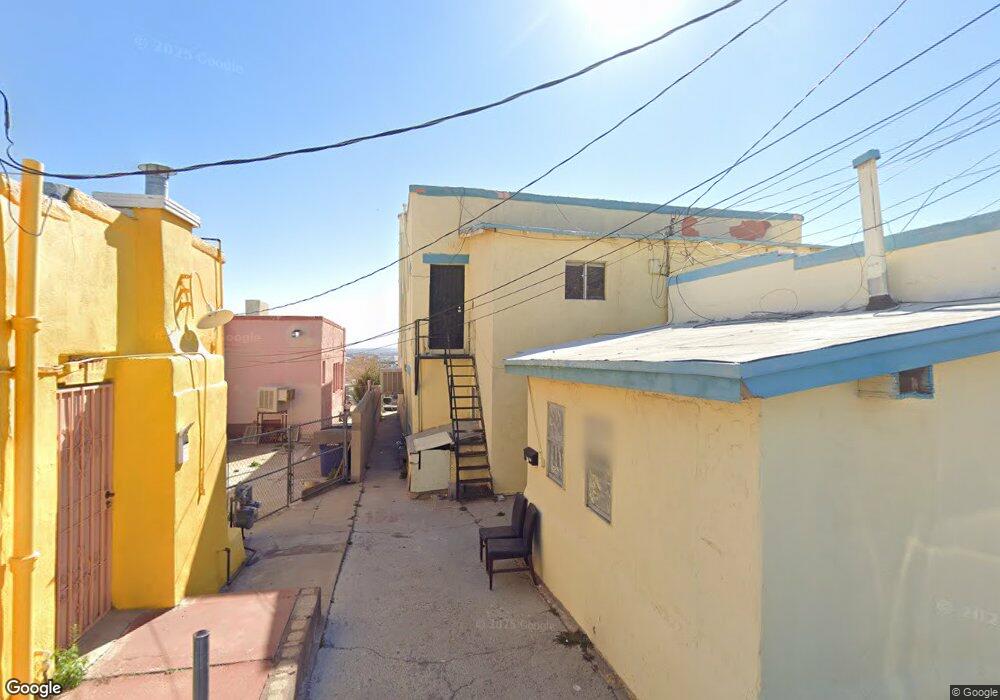
2105 Murchison Dr Unit 1-4 El Paso, TX 79930
Highland Park NeighborhoodEstimated Value: $351,000 - $539,000
Studio
1
Bath
4,248
Sq Ft
$112/Sq Ft
Est. Value
About This Home
This home is located at 2105 Murchison Dr Unit 1-4, El Paso, TX 79930 and is currently estimated at $474,000, approximately $111 per square foot. 2105 Murchison Dr Unit 1-4 is a home located in El Paso County with nearby schools including Moreno Elementary School, Middle School-5 NW Middle, and Austin High School.
Ownership History
Date
Name
Owned For
Owner Type
Purchase Details
Closed on
Jul 25, 2023
Sold by
Aro Investment Properties Llc
Bought by
Flow Realty Services Inc
Current Estimated Value
Purchase Details
Closed on
Oct 31, 2022
Sold by
Common Cents Investments Group Inc
Bought by
Southern Justin
Home Financials for this Owner
Home Financials are based on the most recent Mortgage that was taken out on this home.
Original Mortgage
$386,658
Interest Rate
6.02%
Mortgage Type
New Conventional
Purchase Details
Closed on
Aug 14, 2008
Sold by
Diamond Dennis and Diamond Sandra
Bought by
Arrigucci Joel
Purchase Details
Closed on
May 14, 2005
Sold by
The Los Ninos Childres Irrevocable Tr
Bought by
Diamond Dennis and Diamond Sandra
Purchase Details
Closed on
Jul 9, 2003
Sold by
The Los Ninos Childrens Irrevocable Tr
Bought by
Diamond Family Trust
Create a Home Valuation Report for This Property
The Home Valuation Report is an in-depth analysis detailing your home's value as well as a comparison with similar homes in the area
Home Values in the Area
Average Home Value in this Area
Purchase History
| Date | Buyer | Sale Price | Title Company |
|---|---|---|---|
| Flow Realty Services Inc | -- | None Listed On Document | |
| Southern Justin | -- | -- | |
| Arrigucci Joel | -- | None Available | |
| Diamond Dennis | -- | -- | |
| Diamond Family Trust | -- | -- |
Source: Public Records
Mortgage History
| Date | Status | Borrower | Loan Amount |
|---|---|---|---|
| Previous Owner | Southern Justin | $386,658 |
Source: Public Records
Tax History
| Year | Tax Paid | Tax Assessment Tax Assessment Total Assessment is a certain percentage of the fair market value that is determined by local assessors to be the total taxable value of land and additions on the property. | Land | Improvement |
|---|---|---|---|---|
| 2025 | $8,336 | $374,184 | $24,746 | $349,438 |
| 2024 | $8,336 | $321,144 | $24,746 | $296,398 |
| 2023 | $7,706 | $278,559 | $18,124 | $260,435 |
| 2022 | $7,593 | $256,511 | $18,124 | $238,387 |
| 2021 | $6,042 | $193,516 | $18,124 | $175,392 |
| 2020 | $5,052 | $164,355 | $12,278 | $152,077 |
| 2018 | $4,185 | $141,400 | $12,278 | $129,122 |
| 2017 | $3,997 | $141,904 | $12,278 | $129,626 |
| 2016 | $4,272 | $151,661 | $12,278 | $139,383 |
| 2015 | $4,130 | $151,661 | $12,278 | $139,383 |
| 2014 | $4,130 | $150,944 | $12,278 | $138,666 |
Source: Public Records
Map
Nearby Homes
- 1229 Ohio St
- 2214 Tremont Ave
- 2408 Portland Ave
- 2012 Rogelio Ave
- 2309 San Diego Ave
- 2230 Arizona Ave
- 2212 Silver Ave
- 2214 Arizona Ave
- 2520 San Jose Ave Unit 7C
- 2520 San Jose Ave Unit 4D
- 2520 San Jose Ave Unit 4C
- 1605 Dakota St
- 2427 Gold Ave
- 1907 Grandview Ave
- 2413 Copper Ave
- 2705 Portland Ave
- 1805 Arizona Ave
- 1725 Arizona Ave
- 1511 Camino Alto Rd
- 1813 & 1815 Alabama St
- 2105 Murchison Dr Unit 2109
- 2105 Murchison Dr Unit 3
- 2105 Murchison Dr Unit 2
- 2105 Murchison Dr Unit 1
- 2105 Murchison Dr Unit 4
- 2105 Murchison Dr Unit 5
- 2111 Murchison Dr
- 2115 Murchison Dr
- 2106 Tremont Ave
- 2108 Tremont Ave
- 1230 N Cotton St
- 2110 Tremont Ave
- 2121 1/2 Murchison Dr
- 2112 Tremont Ave
- 2100 Murchison Dr
- 2114 Tremont Ave
- 2118 Tremont Ave
- 2127 Murchison Dr
- 2126 Murchison Dr
- 1231 Ohio St
Your Personal Tour Guide
Ask me questions while you tour the home.