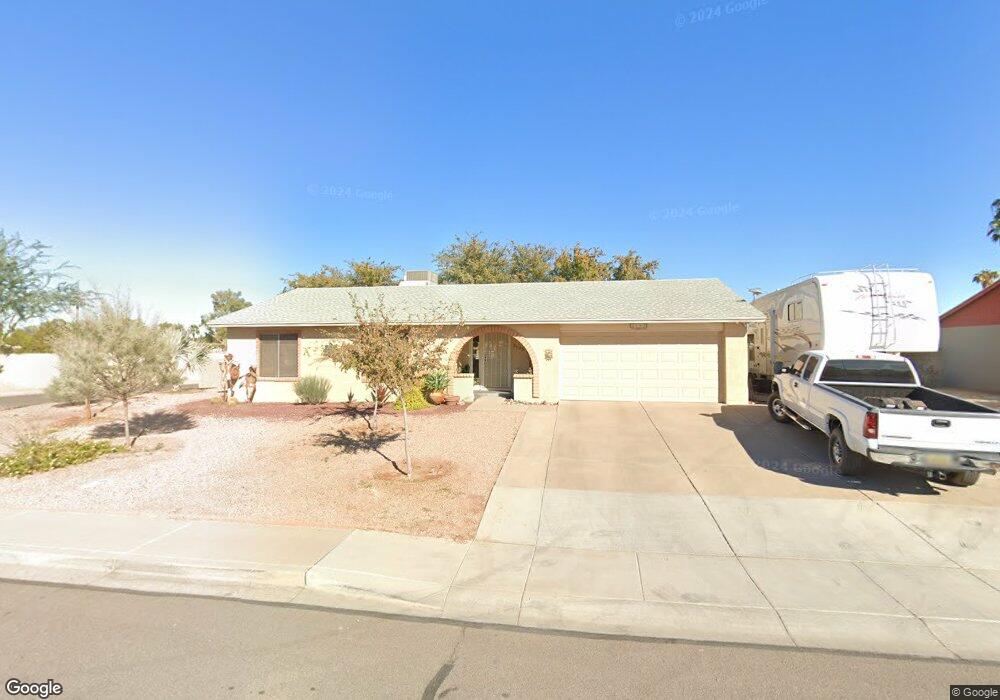
2105 N Tamarisk St Chandler, AZ 85224
Central Ridge NeighborhoodEstimated Value: $392,700 - $511,000
--
Bed
2
Baths
1,376
Sq Ft
$338/Sq Ft
Est. Value
About This Home
This home is located at 2105 N Tamarisk St, Chandler, AZ 85224 and is currently estimated at $465,175, approximately $338 per square foot. 2105 N Tamarisk St is a home located in Maricopa County with nearby schools including Pomeroy Elementary School, Franklin at Brimhall Elementary School, and Summit Academy Elementary.
Ownership History
Date
Name
Owned For
Owner Type
Purchase Details
Closed on
Jun 21, 2019
Sold by
Hatch Verl Lee and Hatch Kathleen D
Bought by
Faken Gene A and Faken Mary E
Current Estimated Value
Home Financials for this Owner
Home Financials are based on the most recent Mortgage that was taken out on this home.
Original Mortgage
$253,650
Outstanding Balance
$223,020
Interest Rate
4.1%
Mortgage Type
New Conventional
Estimated Equity
$242,155
Purchase Details
Closed on
Aug 27, 1996
Sold by
Carbacio Joseph J and Carbacio Roseann V
Bought by
Hatch Verl Lee and Hatch Verl L
Home Financials for this Owner
Home Financials are based on the most recent Mortgage that was taken out on this home.
Original Mortgage
$89,100
Interest Rate
8.37%
Mortgage Type
New Conventional
Create a Home Valuation Report for This Property
The Home Valuation Report is an in-depth analysis detailing your home's value as well as a comparison with similar homes in the area
Home Values in the Area
Average Home Value in this Area
Purchase History
| Date | Buyer | Sale Price | Title Company |
|---|---|---|---|
| Faken Gene A | $267,000 | Premier Title Agency | |
| Hatch Verl Lee | $99,000 | Chicago Title Insurance Co |
Source: Public Records
Mortgage History
| Date | Status | Borrower | Loan Amount |
|---|---|---|---|
| Open | Faken Gene A | $253,650 | |
| Previous Owner | Hatch Verl Lee | $89,100 |
Source: Public Records
Tax History Compared to Growth
Tax History
| Year | Tax Paid | Tax Assessment Tax Assessment Total Assessment is a certain percentage of the fair market value that is determined by local assessors to be the total taxable value of land and additions on the property. | Land | Improvement |
|---|---|---|---|---|
| 2025 | $1,439 | $16,876 | -- | -- |
| 2024 | $1,453 | $16,072 | -- | -- |
| 2023 | $1,453 | $33,760 | $6,750 | $27,010 |
| 2022 | $1,413 | $25,100 | $5,020 | $20,080 |
| 2021 | $1,421 | $23,410 | $4,680 | $18,730 |
| 2020 | $1,405 | $21,320 | $4,260 | $17,060 |
| 2019 | $1,294 | $19,550 | $3,910 | $15,640 |
| 2018 | $854 | $13,970 | $2,790 | $11,180 |
| 2017 | $824 | $13,970 | $2,790 | $11,180 |
| 2016 | $833 | $13,970 | $2,790 | $11,180 |
| 2015 | $1,112 | $13,970 | $2,790 | $11,180 |
Source: Public Records
Map
Nearby Homes
- 2210 N Los Altos Dr
- 2431 W Los Arboles Place
- 2103 W Palomino Dr
- 2100 W Lemon Tree Place Unit 68
- 2100 W Lemon Tree Place Unit 29
- 2100 W Lemon Tree Place Unit 78
- 2552 N Ellis St
- 2050 N 90th Place
- 2702 W Brooks St
- 1771 W Mariposa Ct
- 2663 W Estrella Dr
- 2221 W Rockwell Dr
- 2029 W Shawnee Dr
- 2129 N Villas Ln
- 2015 N Villas Ln
- 1962 N Blackstone Dr
- 2337 W Cheyenne Dr
- 1728 N Cholla St
- 2674 N El Dorado Dr
- 2104 N Pennington Dr
- 2103 N Tamarisk St
- 2217 W Colt Rd
- 2107 N Tamarisk St
- 2218 W Colt Rd
- 2106 N Tamarisk St
- 2108 N Tamarisk St
- 2101 N Tamarisk St
- 2104 N Tamarisk St
- 2215 W Colt Rd
- 2109 N Tamarisk St
- 2110 N Tamarisk St
- 2214 W Mariposa St
- 2102 N Tamarisk St
- 2213 W Colt Rd
- 2216 W Colt Rd
- 2212 W Mariposa St
- 2100 N Tamarisk St
- 2007 N El Dorado Ct
- 2111 N Tamarisk St
- 2210 W Colt Rd