Estimated Value: $546,000 - $609,000
5
Beds
4
Baths
3,717
Sq Ft
$158/Sq Ft
Est. Value
About This Home
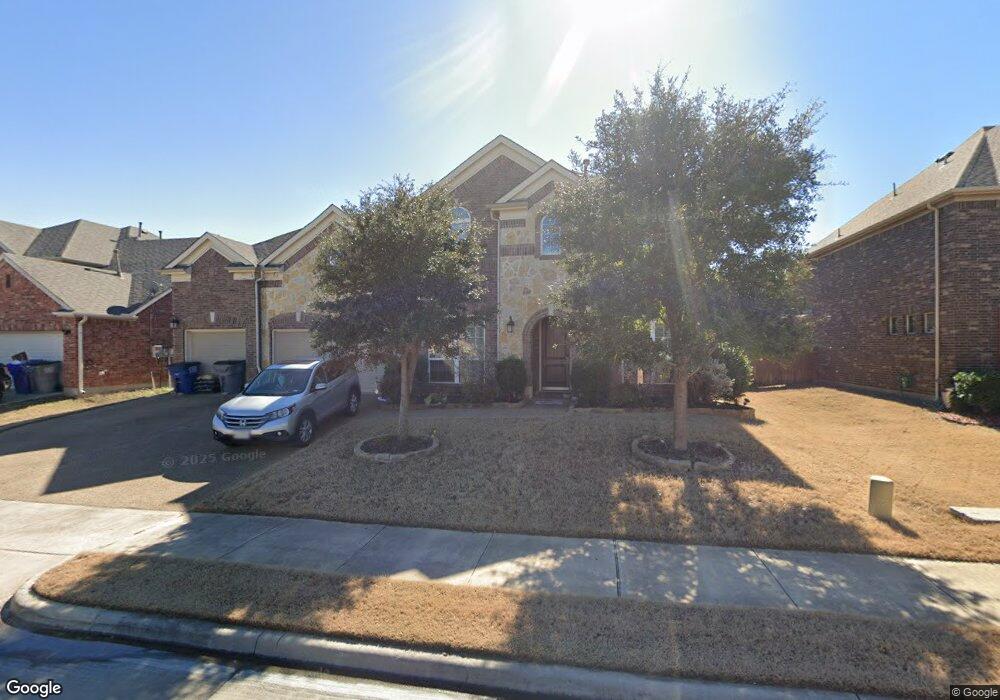
This home is located at 2105 Parkhurst Ct, Wylie, TX 75098 and is currently estimated at $586,989, approximately $157 per square foot. 2105 Parkhurst Ct is a home located in Collin County with nearby schools including Rita Smith Elementary School, Frank Mcmillan Junior High School, and Davis Intermediate School.
Ownership History
Date
Name
Owned For
Owner Type
Purchase Details
Closed on
Mar 8, 2019
Sold by
Magnarelli Snyder Gabriel J and Magnarelli Snyder Cara
Bought by
Molcut Liana and Molcut Teodor
Current Estimated Value
Home Financials for this Owner
Home Financials are based on the most recent Mortgage that was taken out on this home.
Original Mortgage
$210,000
Outstanding Balance
$184,626
Interest Rate
4.4%
Mortgage Type
Purchase Money Mortgage
Estimated Equity
$402,363
Purchase Details
Closed on
Oct 28, 2011
Sold by
Grand Homes 2010 Lp
Bought by
Snyder Gabriel J and Snyder Cara Magnarelli
Home Financials for this Owner
Home Financials are based on the most recent Mortgage that was taken out on this home.
Original Mortgage
$247,818
Interest Rate
4.14%
Mortgage Type
Purchase Money Mortgage
Purchase Details
Closed on
Mar 29, 2011
Sold by
Parsons Warner Llc
Bought by
Grand Homes 2010 L P
Create a Home Valuation Report for This Property
The Home Valuation Report is an in-depth analysis detailing your home's value as well as a comparison with similar homes in the area
Home Values in the Area
Average Home Value in this Area
Purchase History
| Date | Buyer | Sale Price | Title Company |
|---|---|---|---|
| Molcut Liana | -- | None Available | |
| Snyder Gabriel J | -- | None Available | |
| Grand Homes 2010 L P | -- | Ct |
Source: Public Records
Mortgage History
| Date | Status | Borrower | Loan Amount |
|---|---|---|---|
| Open | Molcut Liana | $210,000 | |
| Previous Owner | Snyder Gabriel J | $247,818 |
Source: Public Records
Tax History Compared to Growth
Tax History
| Year | Tax Paid | Tax Assessment Tax Assessment Total Assessment is a certain percentage of the fair market value that is determined by local assessors to be the total taxable value of land and additions on the property. | Land | Improvement |
|---|---|---|---|---|
| 2025 | $7,014 | $607,457 | $136,500 | $498,641 |
| 2024 | $7,014 | $552,234 | $136,500 | $468,288 |
| 2023 | $7,014 | $502,031 | $126,000 | $448,895 |
| 2022 | $10,013 | $456,392 | $126,000 | $366,792 |
| 2021 | $9,762 | $414,902 | $78,750 | $336,152 |
| 2020 | $9,827 | $395,764 | $78,750 | $317,014 |
| 2019 | $10,920 | $415,566 | $78,750 | $336,816 |
| 2018 | $10,589 | $393,184 | $78,750 | $314,434 |
| 2017 | $9,764 | $368,607 | $78,750 | $289,857 |
| 2016 | $9,158 | $329,585 | $68,250 | $261,335 |
| 2015 | $8,025 | $316,550 | $68,250 | $248,300 |
Source: Public Records
Map
Nearby Homes
- 2114 Parkhurst Ct
- 207 Creekview Dr
- 301 Creekview Dr
- 2710 W Fm 544
- 208 Lakefront Dr
- 2722 W Fm 544
- 2606 Parkbridge Ct
- 206 Grassy Creek Dr
- 2615 Gum Tree Trail
- Iris Plan at Wooded Creek
- Beckett II Plan at Wooded Creek
- Annabelle III Plan at Wooded Creek
- 307 Wooded Creek Ave
- Istanbul Plan at Woodbridge - Villas
- Prague Plan at Woodbridge - Villas
- Athens Plan at Woodbridge - Villas
- Dublin Plan at Woodbridge - Villas
- 3003 Candlebrook Dr
- 613 Cloverleaf Dr
- 310 Admiral Dr
- 2103 Parkhurst Ct
- 2107 Parkhurst Ct
- 2101 Parkhurst Ct
- 2102 Parkhurst Ct
- 2106 Dewsbury Dr
- 2100 Parkhurst Ct
- 2108 Dewsbury Dr
- 2104 Dewsbury Dr
- 2109 Parkhurst Ct
- 2104 Parkhurst Ct
- 2110 Dewsbury Dr
- 2102 Dewsbury Dr
- 2111 Parkhurst Ct
- 2106 Parkhurst Ct
- 2112 Dewsbury Dr
- 2100 Dewsbury Dr
- 2114 Dewsbury Dr
- 2113 Parkhurst Ct
- 2108 Parkhurst Ct
- 2105 Dewsbury Dr