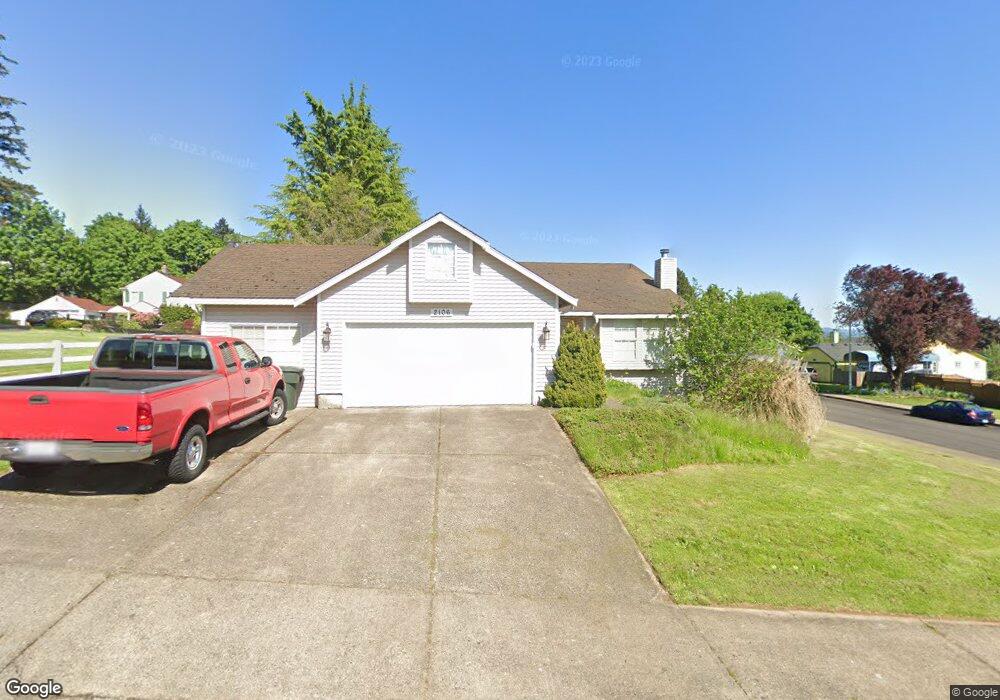
2106 39th St Washougal, WA 98671
Estimated Value: $495,000 - $551,000
3
Beds
2
Baths
1,652
Sq Ft
$320/Sq Ft
Est. Value
About This Home
This home is located at 2106 39th St, Washougal, WA 98671 and is currently estimated at $528,207, approximately $319 per square foot. 2106 39th St is a home located in Clark County with nearby schools including Gause Elementary School, Jemtegaard Middle School, and Washougal High School.
Ownership History
Date
Name
Owned For
Owner Type
Purchase Details
Closed on
May 19, 2010
Sold by
Clark Thomas L and Clark Ethel M
Bought by
Johnson Kenneth A and Johnson Valerie A
Current Estimated Value
Purchase Details
Closed on
Jul 3, 1997
Sold by
Rossignol Claude D and Rossignol Naomi K
Bought by
Clark Thomas L and Clark Ethel M
Home Financials for this Owner
Home Financials are based on the most recent Mortgage that was taken out on this home.
Original Mortgage
$132,000
Interest Rate
5.62%
Purchase Details
Closed on
Feb 14, 1996
Sold by
Grant Homes Inc
Bought by
Rossignol Claude D and Rossignol Naomi K
Home Financials for this Owner
Home Financials are based on the most recent Mortgage that was taken out on this home.
Original Mortgage
$120,000
Interest Rate
7.1%
Create a Home Valuation Report for This Property
The Home Valuation Report is an in-depth analysis detailing your home's value as well as a comparison with similar homes in the area
Home Values in the Area
Average Home Value in this Area
Purchase History
| Date | Buyer | Sale Price | Title Company |
|---|---|---|---|
| Johnson Kenneth A | $217,500 | Fidelity National Title | |
| Clark Thomas L | $165,000 | Chicago Title Insurance Co | |
| Rossignol Claude D | $150,000 | First American Title Ins Co |
Source: Public Records
Mortgage History
| Date | Status | Borrower | Loan Amount |
|---|---|---|---|
| Previous Owner | Clark Thomas L | $132,000 | |
| Previous Owner | Rossignol Claude D | $120,000 |
Source: Public Records
Tax History Compared to Growth
Tax History
| Year | Tax Paid | Tax Assessment Tax Assessment Total Assessment is a certain percentage of the fair market value that is determined by local assessors to be the total taxable value of land and additions on the property. | Land | Improvement |
|---|---|---|---|---|
| 2025 | $4,101 | $426,577 | $120,000 | $306,577 |
| 2024 | $3,998 | $432,137 | $144,000 | $288,137 |
| 2023 | $3,900 | $440,854 | $154,800 | $286,054 |
| 2022 | $3,894 | $421,200 | $154,800 | $266,400 |
| 2021 | $3,763 | $364,916 | $132,000 | $232,916 |
| 2020 | $3,631 | $330,939 | $120,000 | $210,939 |
| 2019 | $3,353 | $324,389 | $120,000 | $204,389 |
| 2018 | $3,585 | $316,728 | $0 | $0 |
| 2017 | $3,102 | $279,497 | $0 | $0 |
| 2016 | $2,999 | $265,656 | $0 | $0 |
| 2015 | $2,885 | $234,853 | $0 | $0 |
| 2014 | -- | $224,800 | $0 | $0 |
| 2013 | -- | $197,376 | $0 | $0 |
Source: Public Records
Map
Nearby Homes