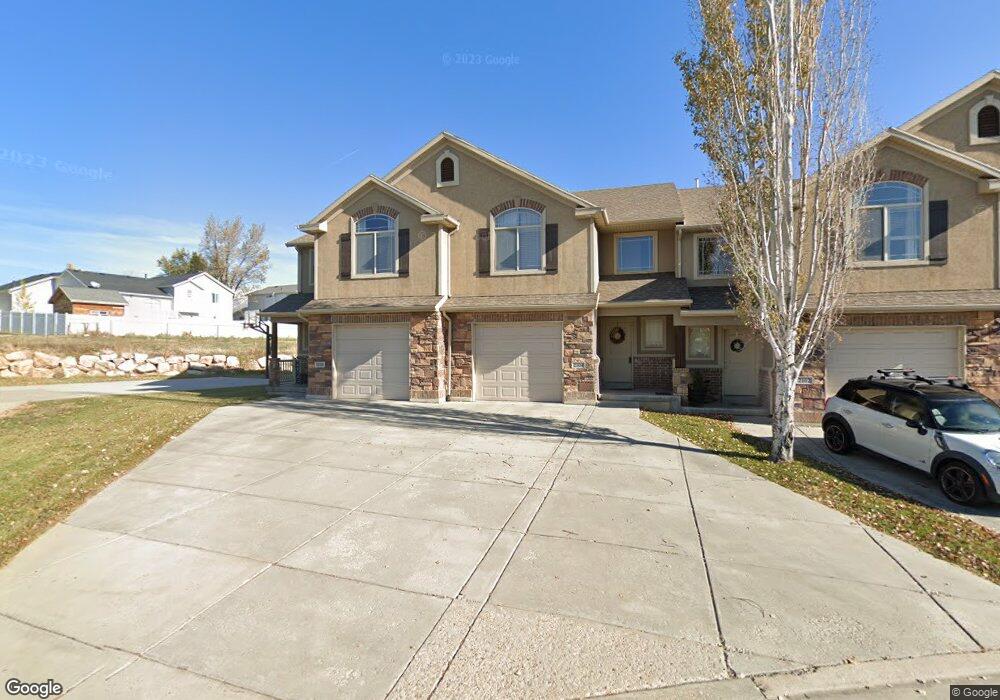
2106 Evans Cove Loop Layton, UT 84041
Estimated Value: $344,000 - $375,611
3
Beds
3
Baths
1,495
Sq Ft
$243/Sq Ft
Est. Value
About This Home
This home is located at 2106 Evans Cove Loop, Layton, UT 84041 and is currently estimated at $362,653, approximately $242 per square foot. 2106 Evans Cove Loop is a home located in Davis County with nearby schools including Lincoln Elementary School, North Layton Junior High School, and Northridge High School.
Ownership History
Date
Name
Owned For
Owner Type
Purchase Details
Closed on
Dec 13, 2011
Sold by
Florek Brent
Bought by
Florek Brent and Florek Lori A
Current Estimated Value
Purchase Details
Closed on
Dec 9, 2011
Sold by
Guernsey Gary Russell
Bought by
Florek Brent
Purchase Details
Closed on
Nov 30, 2011
Sold by
Guernsey Susan E
Bought by
Guernsey Gary Russell
Purchase Details
Closed on
Jan 25, 2011
Sold by
Guernsey Gary Russell
Bought by
Guernsey Susan E
Purchase Details
Closed on
Jun 2, 2006
Sold by
Nilson & Co Inc
Bought by
Guernsey Gary Russell
Home Financials for this Owner
Home Financials are based on the most recent Mortgage that was taken out on this home.
Original Mortgage
$127,120
Interest Rate
1.25%
Mortgage Type
Fannie Mae Freddie Mac
Create a Home Valuation Report for This Property
The Home Valuation Report is an in-depth analysis detailing your home's value as well as a comparison with similar homes in the area
Home Values in the Area
Average Home Value in this Area
Purchase History
| Date | Buyer | Sale Price | Title Company |
|---|---|---|---|
| Florek Brent | -- | Us Title Company Of | |
| Florek Brent | -- | Us Title Company Of | |
| Guernsey Gary Russell | -- | Us Title Company Of | |
| Guernsey Susan E | -- | Accommodation | |
| Guernsey Gary Russell | -- | Bonneville Title Company |
Source: Public Records
Mortgage History
| Date | Status | Borrower | Loan Amount |
|---|---|---|---|
| Previous Owner | Guernsey Gary Russell | $127,120 |
Source: Public Records
Tax History
| Year | Tax Paid | Tax Assessment Tax Assessment Total Assessment is a certain percentage of the fair market value that is determined by local assessors to be the total taxable value of land and additions on the property. | Land | Improvement |
|---|---|---|---|---|
| 2025 | $1,808 | $189,750 | $68,200 | $121,550 |
| 2024 | $1,753 | $185,350 | $52,250 | $133,100 |
| 2023 | $1,819 | $186,450 | $50,050 | $136,400 |
| 2022 | $1,837 | $338,000 | $83,000 | $255,000 |
| 2021 | $1,676 | $253,000 | $69,000 | $184,000 |
| 2020 | $1,554 | $225,000 | $51,000 | $174,000 |
| 2019 | $1,544 | $219,000 | $49,000 | $170,000 |
| 2018 | $1,369 | $195,000 | $49,000 | $146,000 |
| 2016 | $1,161 | $85,250 | $26,950 | $58,300 |
| 2015 | $1,130 | $78,815 | $26,950 | $51,865 |
| 2014 | $1,124 | $80,121 | $18,333 | $61,788 |
| 2013 | -- | $83,068 | $15,400 | $67,668 |
Source: Public Records
Map
Nearby Homes
- 1908 N 200 W
- 1857 N 50 W
- 14 W Belvedere Way
- 2214 N 450 W
- 2234 N 450 W
- 2246 N 475 W
- 498 W 2200 N
- 506 W 2200 N
- 2500 N Fort Ln Unit 212
- 2500 N Fort Ln Unit 244
- 2186 N 525 W
- 1683 N 250 W
- 2236 N 525 W
- 2600 N Hill Field Rd Unit 134
- 2600 N Hill Field Rd Unit 4
- 1571 N 160 W
- 579 W 2350 N
- 621 Paul Ave
- 2149 N 750 W
- 227 E 1500 N
- 2104 Evans Cove Loop
- 2104 Evans Cove Loop Unit 21
- 2120 Evans Cove Loop Unit Layton
- 2102 Evans Cove Loop
- 2098 Evans Cove Loop
- 2094 Evans Cove Loop
- 2088 Evans Cove Loop
- 120 Evans Cove Loop
- 120 Evans Cove Loop Unit 27
- 2097 N 50 W
- 124 Evans Cove Loop
- 2082 Evans Cove Loop
- 2082 Evans Cove Loop Unit 16
- 128 Evans Cove Loop
- 2089 Evans Cove Loop
- 2078 Evans Cove Loop
- 2083 Evans Cove Loop
- 2083 Evans Cove Loop Unit 60
- 132 Evans Cove Loop
- 135 Evans Cove Loop
Your Personal Tour Guide
Ask me questions while you tour the home.