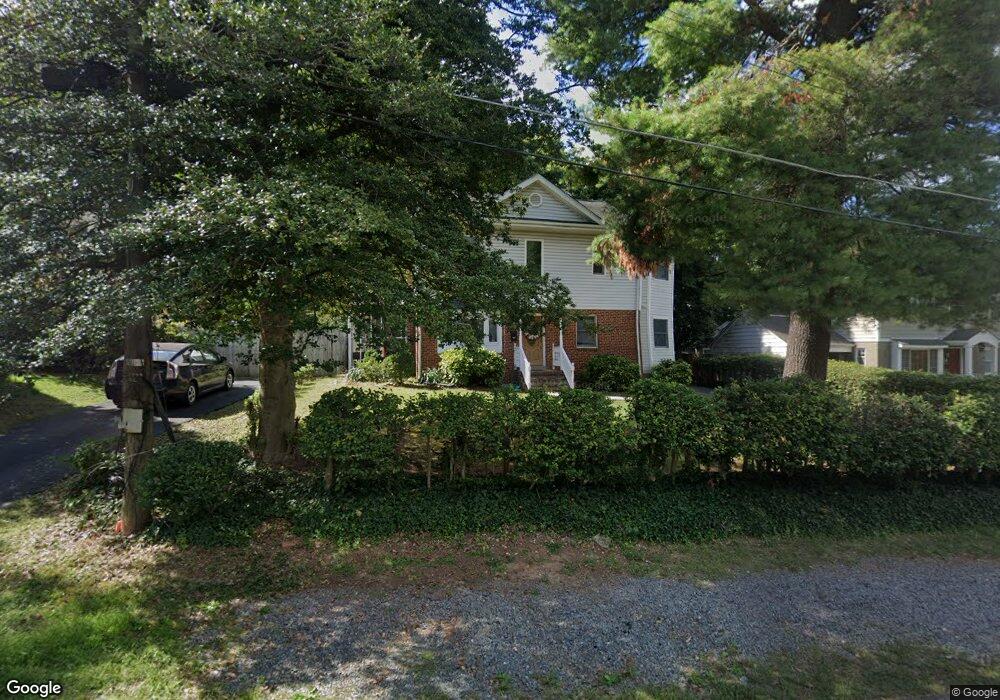
2106 Greenwich St Falls Church, VA 22043
Estimated Value: $1,161,000 - $1,503,000
4
Beds
3
Baths
2,540
Sq Ft
$512/Sq Ft
Est. Value
About This Home
This home is located at 2106 Greenwich St, Falls Church, VA 22043 and is currently estimated at $1,301,235, approximately $512 per square foot. 2106 Greenwich St is a home located in Fairfax County with nearby schools including Haycock Elementary School, Longfellow Middle School, and St. James Catholic School.
Ownership History
Date
Name
Owned For
Owner Type
Purchase Details
Closed on
Apr 10, 1998
Sold by
Hagen Lynn R
Bought by
Nguyen Hung T and Nguyen Sesil O
Current Estimated Value
Home Financials for this Owner
Home Financials are based on the most recent Mortgage that was taken out on this home.
Original Mortgage
$108,000
Outstanding Balance
$20,287
Interest Rate
6.98%
Mortgage Type
New Conventional
Estimated Equity
$1,280,948
Create a Home Valuation Report for This Property
The Home Valuation Report is an in-depth analysis detailing your home's value as well as a comparison with similar homes in the area
Home Values in the Area
Average Home Value in this Area
Purchase History
| Date | Buyer | Sale Price | Title Company |
|---|---|---|---|
| Nguyen Hung T | $135,000 | -- |
Source: Public Records
Mortgage History
| Date | Status | Borrower | Loan Amount |
|---|---|---|---|
| Open | Nguyen Hung T | $108,000 |
Source: Public Records
Tax History Compared to Growth
Tax History
| Year | Tax Paid | Tax Assessment Tax Assessment Total Assessment is a certain percentage of the fair market value that is determined by local assessors to be the total taxable value of land and additions on the property. | Land | Improvement |
|---|---|---|---|---|
| 2025 | $12,434 | $1,032,020 | $515,000 | $517,020 |
| 2024 | $12,434 | $1,005,400 | $515,000 | $490,400 |
| 2023 | $11,259 | $935,230 | $477,000 | $458,230 |
| 2022 | $10,672 | $874,130 | $422,000 | $452,130 |
| 2021 | $9,528 | $762,920 | $422,000 | $340,920 |
| 2020 | $9,333 | $742,920 | $414,000 | $328,920 |
| 2019 | $8,869 | $703,210 | $414,000 | $289,210 |
| 2018 | $7,715 | $670,840 | $398,000 | $272,840 |
| 2017 | $8,288 | $670,840 | $398,000 | $272,840 |
| 2016 | $8,035 | $650,890 | $386,000 | $264,890 |
| 2015 | $7,438 | $622,700 | $368,000 | $254,700 |
| 2014 | $7,462 | $626,200 | $368,000 | $258,200 |
Source: Public Records
Map
Nearby Homes
- 2118 Greenwich St
- 2202 Grayson Place
- 6975 Idylwood Rd
- 7306 Idylbrook Ct
- 6990 Falls Reach Dr Unit 313
- 6927 Haycock Rd
- 2240 Highland Terrace
- 6712 Moly Dr
- 2003 Hillside Dr
- 6956 Birch St
- 255 W Falls Station Blvd Unit 704
- 255 W Falls Station Blvd Unit PH3
- 255 W Falls Station Blvd Unit 1004
- 255 W Falls Station Blvd Unit PH8
- 255 W Falls Station Blvd Unit 609
- 255 W Falls Station Blvd Unit 314
- 255 W Falls Station Blvd Unit 607
- 255 W Falls Station Blvd Unit 302
- 255 W Falls Station Blvd Unit PH1
- 255 W Falls Station Blvd Unit PH4
- 2104 Greenwich St
- 2108 Greenwich St
- 2102 Greenwich St
- 2110 Greenwich St
- 2112 Greenwich St
- 2100 Greenwich St
- 2105 Greenwich St
- 2103 Greenwich St
- 2107 Greenwich St
- 2114 Greenwich St
- 2101 Greenwich St
- 2109 Greenwich St
- 2050 Greenwich St
- 2111 Greenwich St
- 2048 Greenwich St
- 2116 Greenwich St
- 2110 Grayson Place
- 2112 Grayson Place
- 2108 Grayson Place
- 6990 Galway Place