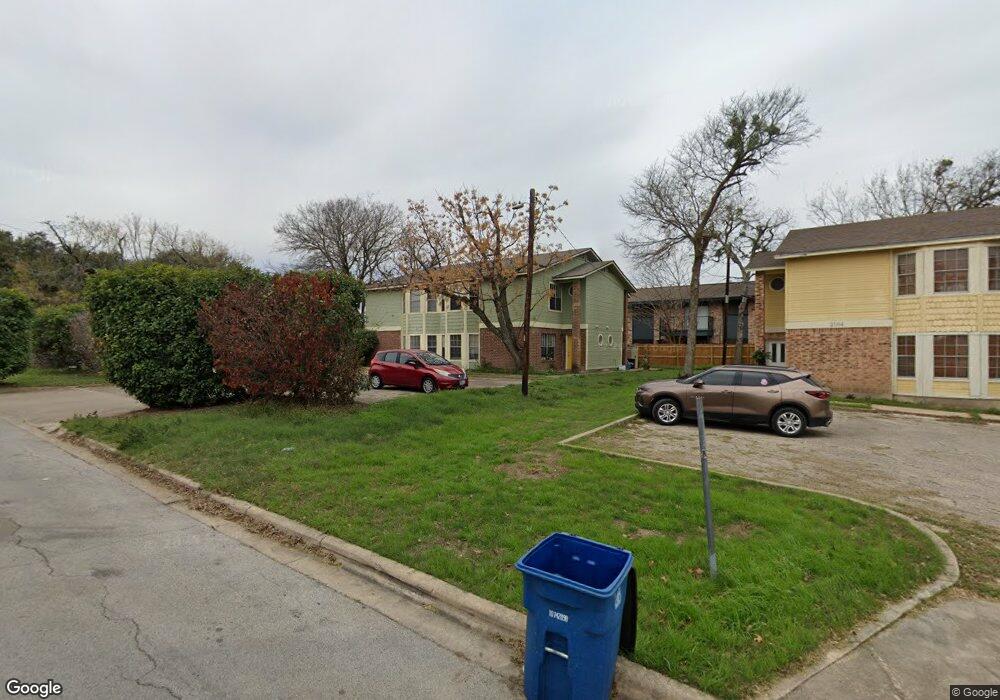
2106 Kirksey Dr Unit A,C Austin, TX 78741
East Riverside-Oltorf NeighborhoodEstimated Value: $667,874 - $767,000
2
Beds
3
Baths
4,092
Sq Ft
$175/Sq Ft
Est. Value
About This Home
This home is located at 2106 Kirksey Dr Unit A,C, Austin, TX 78741 and is currently estimated at $715,969, approximately $174 per square foot. 2106 Kirksey Dr Unit A,C is a home located in Travis County with nearby schools including Allison Elementary School, Martin Middle School, and Eastside Early College High School.
Ownership History
Date
Name
Owned For
Owner Type
Purchase Details
Closed on
Nov 29, 2023
Sold by
Welsh Evan and Welsh Amber
Bought by
Hoang Thuynhu
Current Estimated Value
Home Financials for this Owner
Home Financials are based on the most recent Mortgage that was taken out on this home.
Original Mortgage
$632,000
Outstanding Balance
$621,768
Interest Rate
7.63%
Mortgage Type
New Conventional
Estimated Equity
$94,201
Purchase Details
Closed on
Mar 2, 2011
Sold by
Mendoza Robert J and Mendoza Cynthia R
Bought by
Welsh Evan and Welsh Amber
Home Financials for this Owner
Home Financials are based on the most recent Mortgage that was taken out on this home.
Original Mortgage
$182,100
Interest Rate
4.73%
Mortgage Type
Purchase Money Mortgage
Purchase Details
Closed on
Jul 27, 2000
Sold by
Keirns Harry D and Keirns Nancy A
Bought by
Karney James L
Home Financials for this Owner
Home Financials are based on the most recent Mortgage that was taken out on this home.
Original Mortgage
$172,000
Interest Rate
8.23%
Mortgage Type
Purchase Money Mortgage
Create a Home Valuation Report for This Property
The Home Valuation Report is an in-depth analysis detailing your home's value as well as a comparison with similar homes in the area
Home Values in the Area
Average Home Value in this Area
Purchase History
| Date | Buyer | Sale Price | Title Company |
|---|---|---|---|
| Hoang Thuynhu | -- | None Listed On Document | |
| Welsh Evan | -- | None Available | |
| Karney James L | -- | -- |
Source: Public Records
Mortgage History
| Date | Status | Borrower | Loan Amount |
|---|---|---|---|
| Open | Hoang Thuynhu | $632,000 | |
| Previous Owner | Welsh Evan | $182,100 | |
| Previous Owner | Karney James L | $172,000 |
Source: Public Records
Tax History Compared to Growth
Tax History
| Year | Tax Paid | Tax Assessment Tax Assessment Total Assessment is a certain percentage of the fair market value that is determined by local assessors to be the total taxable value of land and additions on the property. | Land | Improvement |
|---|---|---|---|---|
| 2025 | $13,598 | $637,339 | $254,052 | $383,287 |
| 2023 | $9,834 | $543,549 | $75,000 | $468,549 |
| 2022 | $11,926 | $603,876 | $75,000 | $528,876 |
| 2021 | $9,647 | $443,219 | $75,000 | $368,219 |
| 2020 | $9,523 | $444,000 | $75,000 | $369,000 |
| 2018 | $4,696 | $212,114 | $20,000 | $192,114 |
| 2017 | $4,734 | $212,293 | $20,000 | $192,293 |
| 2016 | $4,734 | $212,293 | $20,000 | $192,293 |
| 2015 | $5,709 | $239,887 | $20,000 | $219,887 |
| 2014 | $5,709 | $239,887 | $20,000 | $219,887 |
Source: Public Records
Map
Nearby Homes
- 1901 Crossing Place Unit 3101
- 1705 Crossing Place Unit 109
- 1810 River Crossing Cir Unit B
- 1601 Faro Dr Unit 1102
- 5702 Penick Dr
- 4707 E Oltorf St
- 4709 E Oltorf St
- 4500 E Oltorf St Unit A105
- 4901 Stella Link
- 4905 Meller Gardens
- 4405 Festival Path Unit 28
- 2450 Wickersham Ln Unit 501
- 2450 Wickersham Ln Unit 2011
- 2450 Wickersham Ln Unit 103
- 2450 Wickersham Ln Unit M1307
- 2450 Wickersham Ln Unit 205
- 2450 Wickersham Ln Unit 1921
- 2450 Wickersham Ln Unit 304
- 2450 Wickersham Ln Unit 106
- 2450 Wickersham Ln Unit J1001
- 2106 Kirksey Dr Unit A
- 2106 Kirksey Dr Unit B
- 2106 Kirksey Dr Unit D
- 2106 Kirksey Dr
- 2104 Kirksey Dr Unit A
- 2104 Kirksey Dr Unit D
- 2104 Kirksey Dr Unit C
- 2104 Kirksey Dr
- 2102 Kirksey Dr Unit D
- 2102 Kirksey Dr Unit C
- 2102 Kirksey Dr Unit B
- 2102 Kirksey Dr Unit A
- 2102 Kirksey Dr
- 2107 Kirksey Dr
- 2105 Kirksey Dr Unit B
- 2105 Kirksey Dr
- 2103 Kirksey Dr Unit B
- 2103 Kirksey Dr
- 2100 Kirksey Dr Unit B
- 2100 Kirksey Dr Unit D