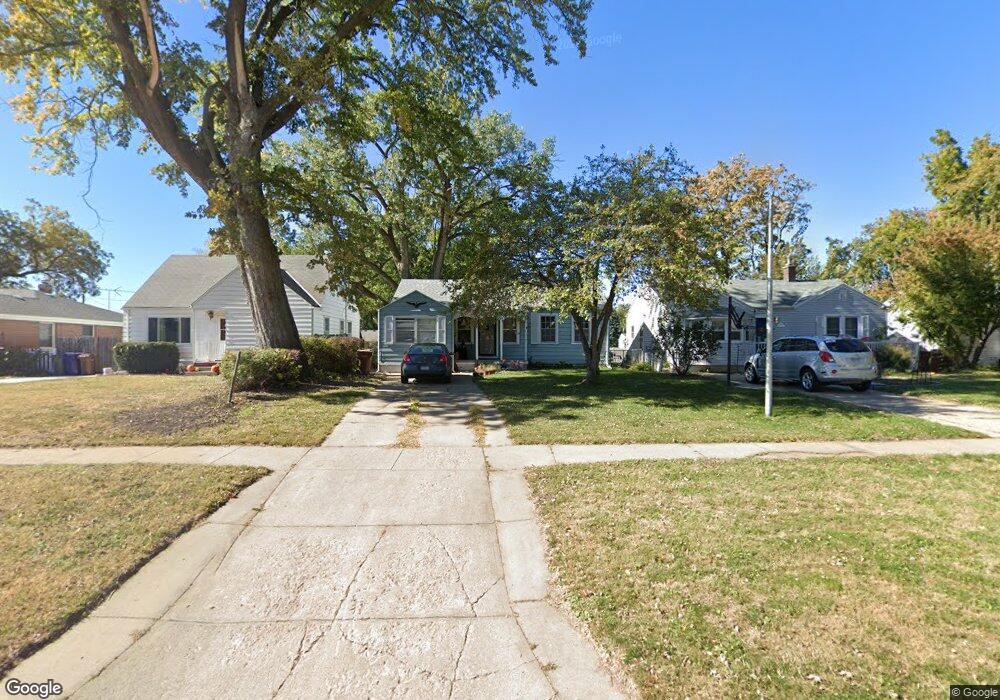
2106 Main St Bellevue, NE 68005
Estimated Value: $151,000 - $199,000
3
Beds
1
Bath
1,381
Sq Ft
$124/Sq Ft
Est. Value
About This Home
This home is located at 2106 Main St, Bellevue, NE 68005 and is currently estimated at $170,899, approximately $123 per square foot. 2106 Main St is a home located in Sarpy County with nearby schools including Bertha Barber Elementary School, Bellevue Mission Middle School, and Bellevue East High School.
Ownership History
Date
Name
Owned For
Owner Type
Purchase Details
Closed on
Mar 15, 2022
Sold by
Francois James M and Francois Cheryl L
Bought by
J And C 5656 Enterprises Llc
Current Estimated Value
Purchase Details
Closed on
Mar 15, 2010
Sold by
Vaughan Charles A and Vaughan Penny S
Bought by
Francois James and Francois Cheryl
Purchase Details
Closed on
Nov 25, 2008
Sold by
Federal National Mortgage Association
Bought by
Vaughan Charles A and Schaffer Timothy J
Purchase Details
Closed on
Oct 27, 2008
Sold by
Zuger Brian Paul and Zuger Heather Joann
Bought by
Federal National Mortgage Association
Purchase Details
Closed on
Aug 8, 1998
Sold by
Woodford Loretta A and Woodford Loretta A
Bought by
Zuger Brian Paul and Zuger Heather Joann
Home Financials for this Owner
Home Financials are based on the most recent Mortgage that was taken out on this home.
Original Mortgage
$61,595
Interest Rate
6.94%
Create a Home Valuation Report for This Property
The Home Valuation Report is an in-depth analysis detailing your home's value as well as a comparison with similar homes in the area
Home Values in the Area
Average Home Value in this Area
Purchase History
| Date | Buyer | Sale Price | Title Company |
|---|---|---|---|
| J And C 5656 Enterprises Llc | -- | None Listed On Document | |
| Francois James | $50,000 | Nct | |
| Vaughan Charles A | -- | Nlta | |
| Federal National Mortgage Association | $65,036 | None Available | |
| Zuger Brian Paul | $64,000 | Ati Title |
Source: Public Records
Mortgage History
| Date | Status | Borrower | Loan Amount |
|---|---|---|---|
| Previous Owner | Zuger Brian Paul | $61,595 |
Source: Public Records
Tax History
| Year | Tax Paid | Tax Assessment Tax Assessment Total Assessment is a certain percentage of the fair market value that is determined by local assessors to be the total taxable value of land and additions on the property. | Land | Improvement |
|---|---|---|---|---|
| 2025 | $2,325 | $147,504 | $30,000 | $117,504 |
| 2024 | $2,570 | $133,190 | $25,000 | $108,190 |
| 2023 | $2,570 | $121,727 | $25,000 | $96,727 |
| 2022 | $2,299 | $106,838 | $20,000 | $86,838 |
| 2021 | $2,125 | $97,710 | $18,000 | $79,710 |
| 2020 | $1,988 | $91,103 | $18,000 | $73,103 |
| 2019 | $1,880 | $86,695 | $18,000 | $68,695 |
| 2018 | $1,783 | $84,448 | $18,000 | $66,448 |
| 2017 | $1,700 | $79,948 | $18,000 | $61,948 |
| 2016 | $1,596 | $76,740 | $18,000 | $58,740 |
| 2015 | $1,556 | $75,243 | $18,000 | $57,243 |
| 2014 | $1,584 | $76,083 | $18,000 | $58,083 |
| 2012 | -- | $85,176 | $18,000 | $67,176 |
Source: Public Records
Map
Nearby Homes
- 1908 Warren St
- 2309 Main St
- 307 E 17th Ave
- 1701 Jefferson St
- 411 W 22nd Ave
- 1509 Warren St
- 2503 Washington St
- 2303 Madison St
- 2504 Washington St
- 2411 Madison St
- 1404 Warren St
- 706 Lemay Dr
- 2802 Wayne St
- 1105 Kountze Memorial Dr
- 409 W 30th Ave
- 3101 Washington St Unit 15
- 3101 Washington St Unit 53
- 3101 Washington St Unit Lot 18
- 3101 Washington St Unit 73
- 3101 Washington St Unit lot 69
Your Personal Tour Guide
Ask me questions while you tour the home.