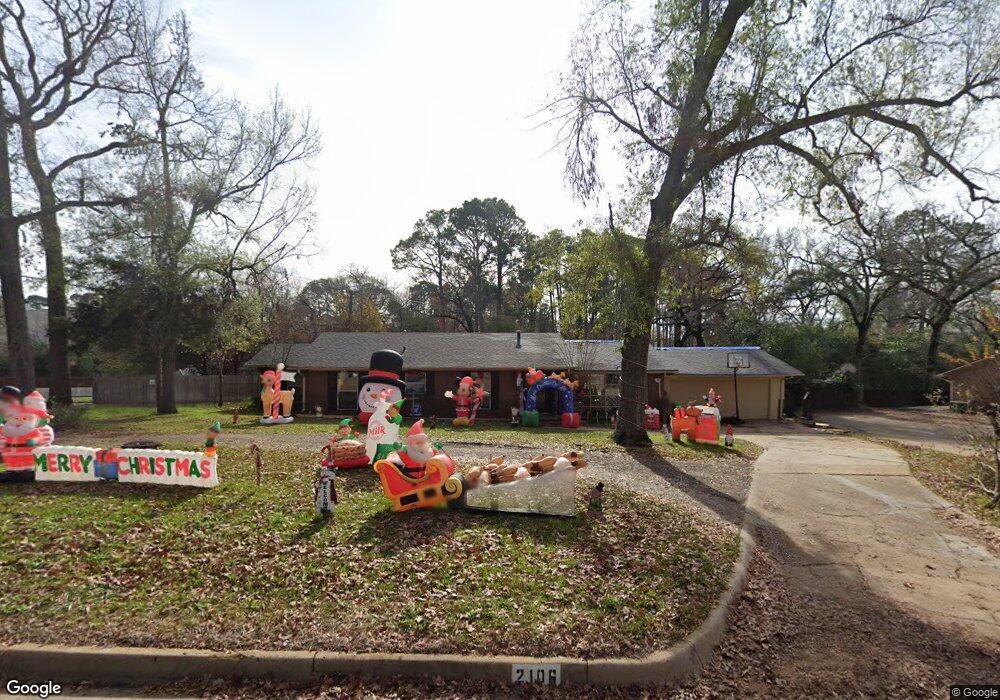
2106 Old Jacksonville Rd Tyler, TX 75701
Azalea District NeighborhoodEstimated Value: $286,000 - $304,355
--
Bed
2
Baths
2,371
Sq Ft
$123/Sq Ft
Est. Value
About This Home
This home is located at 2106 Old Jacksonville Rd, Tyler, TX 75701 and is currently estimated at $292,339, approximately $123 per square foot. 2106 Old Jacksonville Rd is a home located in Smith County with nearby schools including Woods Elementary School, Hogg Middle School, and Tyler Legacy High School.
Ownership History
Date
Name
Owned For
Owner Type
Purchase Details
Closed on
Jul 15, 2021
Sold by
Sds Holdings Llc-Series 2106 Jacksonvill
Bought by
Santana Family Trust
Current Estimated Value
Purchase Details
Closed on
Oct 3, 2014
Sold by
Texas National Bank Jacksonville
Bought by
Trawick Operating
Purchase Details
Closed on
May 24, 2011
Sold by
Bandy Robert M
Bought by
Bryant Sylvia
Purchase Details
Closed on
Mar 18, 2011
Sold by
Bryant Sylvia
Bought by
Smith Shanon
Home Financials for this Owner
Home Financials are based on the most recent Mortgage that was taken out on this home.
Original Mortgage
$40,000
Interest Rate
4.98%
Mortgage Type
Purchase Money Mortgage
Purchase Details
Closed on
Sep 20, 2007
Sold by
Crow Mabel H
Bought by
Bryant Sylvia
Create a Home Valuation Report for This Property
The Home Valuation Report is an in-depth analysis detailing your home's value as well as a comparison with similar homes in the area
Home Values in the Area
Average Home Value in this Area
Purchase History
| Date | Buyer | Sale Price | Title Company |
|---|---|---|---|
| Santana Family Trust | -- | None Listed On Document | |
| Sds Holdings Llc | -- | None Listed On Document | |
| Trawick Operating | -- | -- | |
| Bryant Sylvia | $9,100 | None Available | |
| Smith Shanon | -- | None Available | |
| Smith Shanon | -- | None Available | |
| Smith Shanon | -- | None Available | |
| Bryant Sylvia | -- | None Available |
Source: Public Records
Mortgage History
| Date | Status | Borrower | Loan Amount |
|---|---|---|---|
| Previous Owner | Smith Shanon | $40,000 |
Source: Public Records
Tax History Compared to Growth
Tax History
| Year | Tax Paid | Tax Assessment Tax Assessment Total Assessment is a certain percentage of the fair market value that is determined by local assessors to be the total taxable value of land and additions on the property. | Land | Improvement |
|---|---|---|---|---|
| 2025 | $5,683 | $398,694 | $130,356 | $268,338 |
| 2024 | $5,683 | $334,038 | $44,100 | $289,938 |
| 2023 | $4,971 | $285,175 | $44,100 | $241,075 |
| 2022 | $4,123 | $210,432 | $29,400 | $181,032 |
| 2021 | $2,510 | $119,621 | $29,400 | $90,221 |
| 2020 | $2,526 | $118,055 | $29,400 | $88,655 |
| 2019 | $2,438 | $111,500 | $29,400 | $82,100 |
| 2018 | $2,425 | $111,500 | $29,400 | $82,100 |
| 2017 | $2,380 | $111,500 | $29,400 | $82,100 |
| 2016 | $2,835 | $132,772 | $29,400 | $103,372 |
| 2015 | $2,810 | $136,017 | $29,400 | $106,617 |
| 2014 | $2,810 | $132,253 | $29,400 | $102,853 |
Source: Public Records
Map
Nearby Homes
- 606 Tremont St
- 2864 S Robertson Ave
- 325 W 4th St
- 829 W 10th St
- 2026 S Wall Ave
- 2108 S Wall Ave
- 902 W 9th St
- 906 W 5th St
- 2622 Oak Ln
- 2736 Old Bullard Rd
- 2527 S Robertson Ave
- 1413 Augusta Ave
- 114 E 2nd St
- 309 Glenhaven Dr
- 2110 Belmont Dr
- 317 Amberwood Cir
- TBD Texas 110
- 2835 S Broadway Ave
- 2319 Pollard Dr
- 1203 Dogwood St
- 2106 Old Jacksonville Hwy
- 2201 2201 Old Bullard Rd
- 2201 Old Bullard Rd
- 2202 Old Bullard Rd
- 2120 W Jackson St
- 2115 Old Jacksonville Rd
- 2015 S College Ave
- 2015 2015 S College Ave
- 208 W 9th St
- 2217 Old Bullard Rd
- 2212 Old Bullard Rd
- 2030 S Chilton Ave
- 2030 2030 S Chilton
- 2212 S Chilton Ave
- 2020 S Chilton Ave
- 318 318 W 8th
- 318 W 8th St
- 302 W 8th St
- 2221 2221 Old Bullard Rd
- 2221 Old Bullard Rd