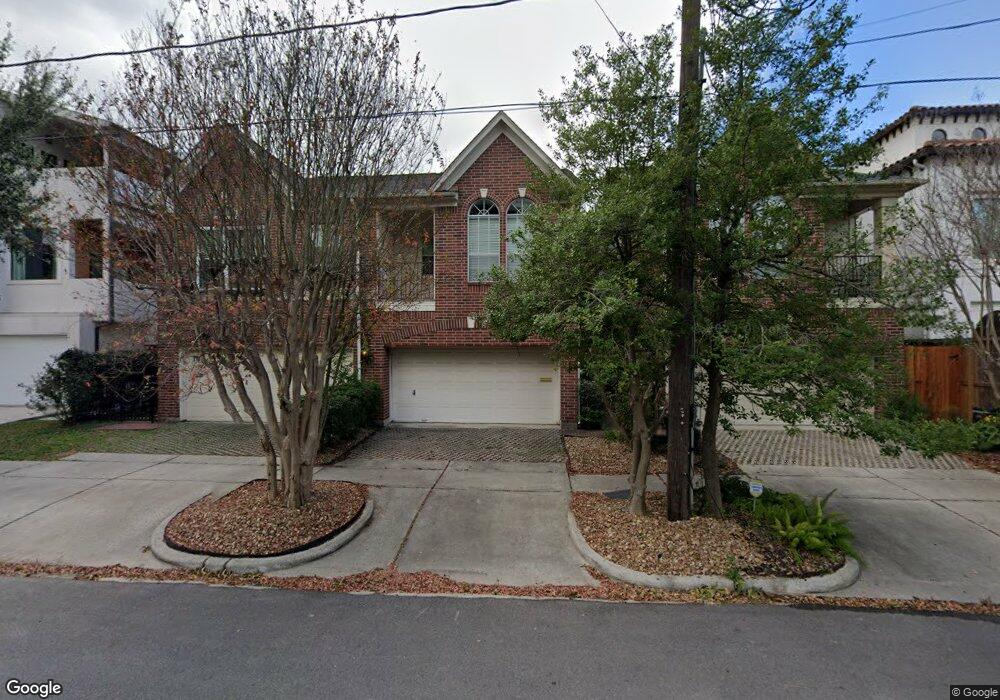
2106 Park St Houston, TX 77019
Montrose NeighborhoodEstimated Value: $647,357 - $962,000
3
Beds
3
Baths
2,995
Sq Ft
$263/Sq Ft
Est. Value
About This Home
This home is located at 2106 Park St, Houston, TX 77019 and is currently estimated at $786,339, approximately $262 per square foot. 2106 Park St is a home located in Harris County with nearby schools including Baker Montessori, Lanier Middle School, and Lamar High School.
Ownership History
Date
Name
Owned For
Owner Type
Purchase Details
Closed on
Feb 17, 1999
Sold by
Lin David W
Bought by
Lin Martin W
Current Estimated Value
Home Financials for this Owner
Home Financials are based on the most recent Mortgage that was taken out on this home.
Original Mortgage
$178,200
Outstanding Balance
$39,125
Interest Rate
5.89%
Mortgage Type
Purchase Money Mortgage
Estimated Equity
$747,214
Purchase Details
Closed on
Aug 2, 1996
Sold by
South Territory Ltd
Bought by
Lin David W
Home Financials for this Owner
Home Financials are based on the most recent Mortgage that was taken out on this home.
Original Mortgage
$240,000
Interest Rate
8.32%
Mortgage Type
Purchase Money Mortgage
Purchase Details
Closed on
Aug 1, 1996
Sold by
Perry Homes
Bought by
Lin David Wei Kuo
Home Financials for this Owner
Home Financials are based on the most recent Mortgage that was taken out on this home.
Original Mortgage
$240,000
Interest Rate
8.32%
Mortgage Type
Purchase Money Mortgage
Create a Home Valuation Report for This Property
The Home Valuation Report is an in-depth analysis detailing your home's value as well as a comparison with similar homes in the area
Home Values in the Area
Average Home Value in this Area
Purchase History
| Date | Buyer | Sale Price | Title Company |
|---|---|---|---|
| Lin Martin W | -- | -- | |
| Lin David W | -- | Commonwealth Land Title Co | |
| Lin David Wei Kuo | -- | Chicago Title |
Source: Public Records
Mortgage History
| Date | Status | Borrower | Loan Amount |
|---|---|---|---|
| Open | Lin Martin W | $178,200 | |
| Closed | Lin David W | $240,000 | |
| Closed | Lin David Wei Kuo | $178,200 |
Source: Public Records
Tax History Compared to Growth
Tax History
| Year | Tax Paid | Tax Assessment Tax Assessment Total Assessment is a certain percentage of the fair market value that is determined by local assessors to be the total taxable value of land and additions on the property. | Land | Improvement |
|---|---|---|---|---|
| 2025 | $9,276 | $645,431 | $259,930 | $385,501 |
| 2024 | $9,276 | $608,205 | $259,930 | $348,275 |
| 2023 | $9,276 | $613,181 | $259,930 | $353,251 |
| 2022 | $12,705 | $500,000 | $259,930 | $240,070 |
| 2021 | $12,687 | $544,368 | $248,115 | $296,253 |
| 2020 | $13,248 | $547,094 | $248,115 | $298,979 |
| 2019 | $13,243 | $523,341 | $144,520 | $378,821 |
| 2018 | $9,667 | $490,000 | $144,520 | $345,480 |
| 2017 | $14,329 | $540,000 | $144,520 | $395,480 |
| 2016 | $14,233 | $540,000 | $144,520 | $395,480 |
| 2015 | $8,984 | $548,761 | $144,520 | $404,241 |
| 2014 | $8,984 | $498,410 | $126,455 | $371,955 |
Source: Public Records
Map
Nearby Homes
- 2025 Park St
- 2011 Woodhead St
- 2003 Morse St
- 1902 Elmen St
- 2314 Park St
- 1728 Michigan St Unit A
- 1728 Michigan St Unit C
- 1718 Welch St Unit C
- 2026 Morse St
- 1906 Woodhead St
- 1808 Ridgewood St
- 1705 Michigan St
- 1822 Morse St Unit A
- 2415 Elmen St
- 2309 Driscoll St
- 1956 Vermont St
- 2103 Hazard St
- 1705 Park St
- 2008 Hazard St
- 2413 Ralph St Unit 2