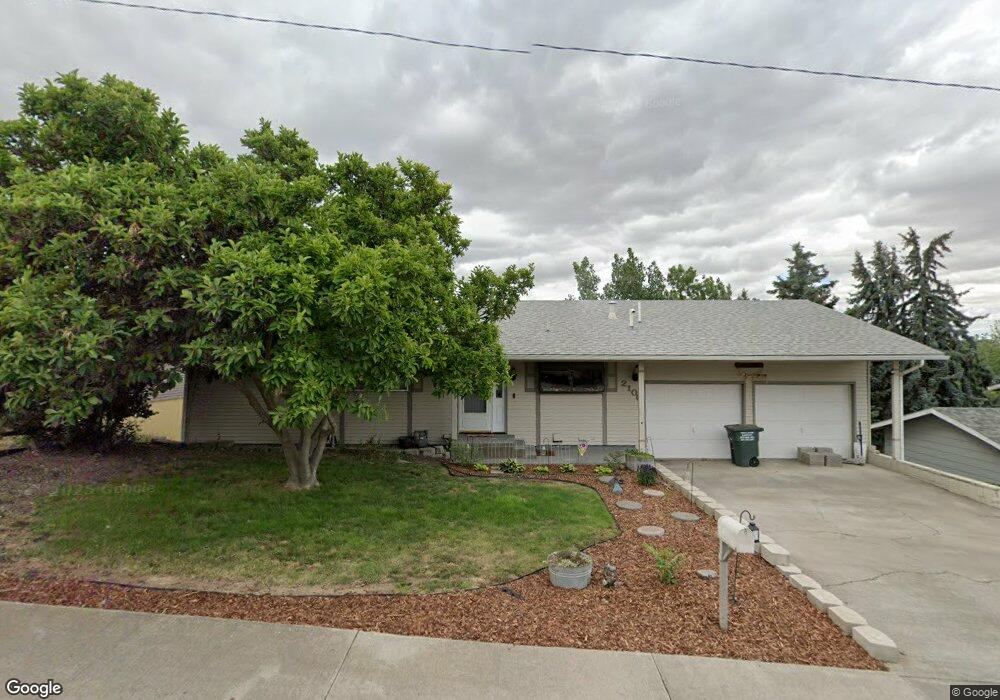
2106 SW Nye Ave Pendleton, OR 97801
Estimated Value: $363,000 - $445,000
4
Beds
3
Baths
2,778
Sq Ft
$143/Sq Ft
Est. Value
About This Home
This home is located at 2106 SW Nye Ave, Pendleton, OR 97801 and is currently estimated at $396,433, approximately $142 per square foot. 2106 SW Nye Ave is a home located in Umatilla County with nearby schools including McKay Creek Elementary School, Sunridge Middle School, and Pendleton High School.
Ownership History
Date
Name
Owned For
Owner Type
Purchase Details
Closed on
Dec 18, 2024
Sold by
William Harland Roesch Family Trust and Roesch William Julius
Bought by
Roesch William J and Roesch Jarrod Patrick
Current Estimated Value
Purchase Details
Closed on
Mar 28, 2017
Sold by
Hardy Stanley R and Hardy Linda K
Bought by
Steele Saundra and Steele Jerrod
Home Financials for this Owner
Home Financials are based on the most recent Mortgage that was taken out on this home.
Original Mortgage
$188,100
Interest Rate
4.14%
Mortgage Type
New Conventional
Purchase Details
Closed on
Sep 25, 2007
Sold by
Jones William C and Jones June Y
Bought by
Hardy Stanley R and Hardy Linda K
Home Financials for this Owner
Home Financials are based on the most recent Mortgage that was taken out on this home.
Original Mortgage
$201,450
Interest Rate
6.61%
Mortgage Type
New Conventional
Create a Home Valuation Report for This Property
The Home Valuation Report is an in-depth analysis detailing your home's value as well as a comparison with similar homes in the area
Home Values in the Area
Average Home Value in this Area
Purchase History
| Date | Buyer | Sale Price | Title Company |
|---|---|---|---|
| Roesch William J | -- | None Listed On Document | |
| Roesch William J | -- | None Listed On Document | |
| Steele Saundra | $198,000 | Amerititle | |
| Hardy Stanley R | $237,000 | Amerititle |
Source: Public Records
Mortgage History
| Date | Status | Borrower | Loan Amount |
|---|---|---|---|
| Previous Owner | Steele Saundra | $188,100 | |
| Previous Owner | Hardy Stanley R | $201,450 |
Source: Public Records
Tax History
| Year | Tax Paid | Tax Assessment Tax Assessment Total Assessment is a certain percentage of the fair market value that is determined by local assessors to be the total taxable value of land and additions on the property. | Land | Improvement |
|---|---|---|---|---|
| 2023 | $5,060 | $271,740 | $54,360 | $217,380 |
Source: Public Records
Map
Nearby Homes
- 1206 SW 24th St
- 1414 SW 24th St
- 0 SW 30th Unit 22542685
- 0 SW Quinney Ln Unit 24414661
- 0 SW Ladow Ave Unit Lot 41
- 0 SW Ladow Ave Unit Lot 42
- 0 SW Ladow Ave Unit Lot 43
- 1901 SW Runnion Ln
- 3014 SW Kirk Ave
- 3 Tutuilla Rd
- 1 SW Tutuilla Creek Rd
- 2 SW Tutuilla Creek Rd
- 1109 SW Nye Ave
- 1004 SW 33rd St
- 3307 SW Kirk Ave
- 0 SW Kirk Ave Unit 200 21392184
- 0 SW Kirk Ave Unit 101 21527345
- 0 SW Kirk Ave Unit 5500 21002117
- 3218 SW Isaac Ave
- 1437 SW 37th St Unit 43
- 2018 SW Nye Ave
- 2112 SW Nye Ave
- 2204 SW Nye Ave
- 2105 SW Olson Ave
- 2019 SW Olson Ave
- 2015 SW Nye Ave
- 2111 SW Olson Ave
- 2117 SW Olson Ave
- 2013 SW Olson Ave
- 1214 SW 21st St
- 1304 SW 23rd St
- 1310 SW 23rd St
- 1210 SW 21st St
- 2020 SW Olson Ave
- 2121 SW Olson Ave
- 2104 SW Olson Ave
- 2108 SW Olson Ave
- 2014 SW Olson Ave
- 2003 SW 18th St
Your Personal Tour Guide
Ask me questions while you tour the home.