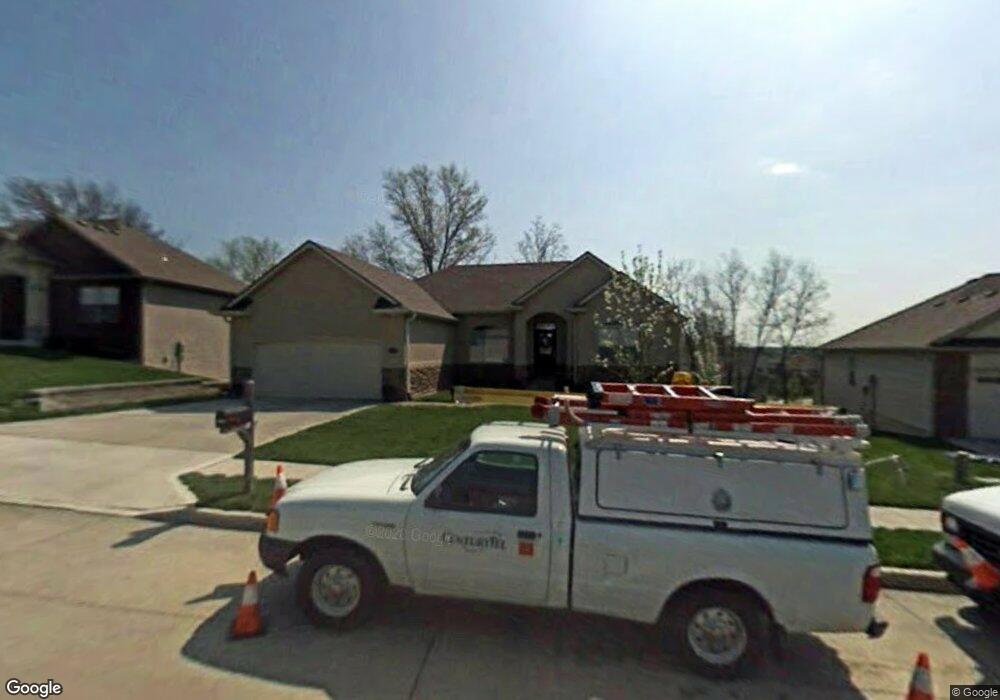
2106 Tadley St Columbia, MO 65203
Estimated Value: $425,000 - $472,000
5
Beds
3
Baths
2,775
Sq Ft
$161/Sq Ft
Est. Value
About This Home
This home is located at 2106 Tadley St, Columbia, MO 65203 and is currently estimated at $446,168, approximately $160 per square foot. 2106 Tadley St is a home located in Boone County with nearby schools including Beulah Ralph Elementary School, Jefferson Middle School, and Rock Bridge High School.
Ownership History
Date
Name
Owned For
Owner Type
Purchase Details
Closed on
Jul 24, 2008
Sold by
Allen Maury D and Allen Melissa K
Bought by
Lowes Daniel and Lowes Jennifer
Current Estimated Value
Home Financials for this Owner
Home Financials are based on the most recent Mortgage that was taken out on this home.
Original Mortgage
$150,000
Outstanding Balance
$98,182
Interest Rate
6.36%
Mortgage Type
Purchase Money Mortgage
Estimated Equity
$347,986
Purchase Details
Closed on
Jul 12, 2006
Sold by
Starr Russell A and Starr Glenna J
Bought by
Lowes Daniel and Starr Jennifer
Purchase Details
Closed on
Apr 28, 2005
Sold by
John Hansman Construction Llc
Bought by
Allen Maury D and Allen Melilssa K
Home Financials for this Owner
Home Financials are based on the most recent Mortgage that was taken out on this home.
Original Mortgage
$191,866
Interest Rate
5%
Mortgage Type
Adjustable Rate Mortgage/ARM
Create a Home Valuation Report for This Property
The Home Valuation Report is an in-depth analysis detailing your home's value as well as a comparison with similar homes in the area
Purchase History
| Date | Buyer | Sale Price | Title Company |
|---|---|---|---|
| Lowes Daniel | -- | Boone Central Title Company | |
| Lowes Daniel | -- | Boone-Central Title Co | |
| Allen Maury D | -- | Boone Central Title Co |
Source: Public Records
Mortgage History
| Date | Status | Borrower | Loan Amount |
|---|---|---|---|
| Open | Lowes Daniel | $150,000 | |
| Previous Owner | Allen Maury D | $191,866 |
Source: Public Records
Tax History Compared to Growth
Tax History
| Year | Tax Paid | Tax Assessment Tax Assessment Total Assessment is a certain percentage of the fair market value that is determined by local assessors to be the total taxable value of land and additions on the property. | Land | Improvement |
|---|---|---|---|---|
| 2025 | $3,873 | $59,147 | $6,422 | $52,725 |
| 2024 | $3,485 | $51,661 | $6,422 | $45,239 |
| 2023 | $3,456 | $51,661 | $6,422 | $45,239 |
| 2022 | $3,198 | $47,842 | $6,422 | $41,420 |
| 2021 | $3,204 | $47,842 | $6,422 | $41,420 |
| 2020 | $3,278 | $46,000 | $6,422 | $39,578 |
| 2019 | $3,278 | $46,000 | $6,422 | $39,578 |
| 2018 | $3,174 | $0 | $0 | $0 |
| 2017 | $3,136 | $44,232 | $6,422 | $37,810 |
| 2016 | $3,130 | $44,232 | $6,422 | $37,810 |
| 2015 | $2,875 | $44,232 | $6,422 | $37,810 |
| 2014 | -- | $44,232 | $6,422 | $37,810 |
Source: Public Records
Map
Nearby Homes
- 1704 Stillpoint Ct
- 1700 Stillpoint Ct
- 5013 City Hill Ct
- 4406 Gage Place
- 2506 Grandview Cir
- 1416 W Georgetown Loop
- 00 W Gillespie Bridge Rd
- 0 W Gillespie Bridge Rd
- 4205 Grant Ln
- 4016 Bent Oak Dr
- 4407 W Brookview Terrace
- 1000 Louisville Dr
- 6041 Tamarack Dr
- 2609 Carrera Dr
- 6050 Tamarack Dr
- 6015 W Swather Ct
- 6035 W Swather Ct
- 6051 Tamarack Dr
- 6031 Tamarack Dr
- 4480 W Bainbridge Dr
- 2104 Tadley St
- 2200 Tadley Dr
- 2200 Tadley St
- 2109 Limestone Ave
- 2107 Limestone Ave
- 2201 Limestone Ave
- 2102 Tadley St
- 2109 Tadley Dr
- 2107 Tadley St
- 2201 Tadley St
- 2105 Limestone Ave
- 2105 Tadley St
- 2203 Limestone Ave
- 2202 Tadley St
- 2100 Tadley St
- 2103 Tadley St
- 2103 Limestone Ave
- 2205 Limestone Ave
- 2204 Tadley St
- 2207 Tadley St