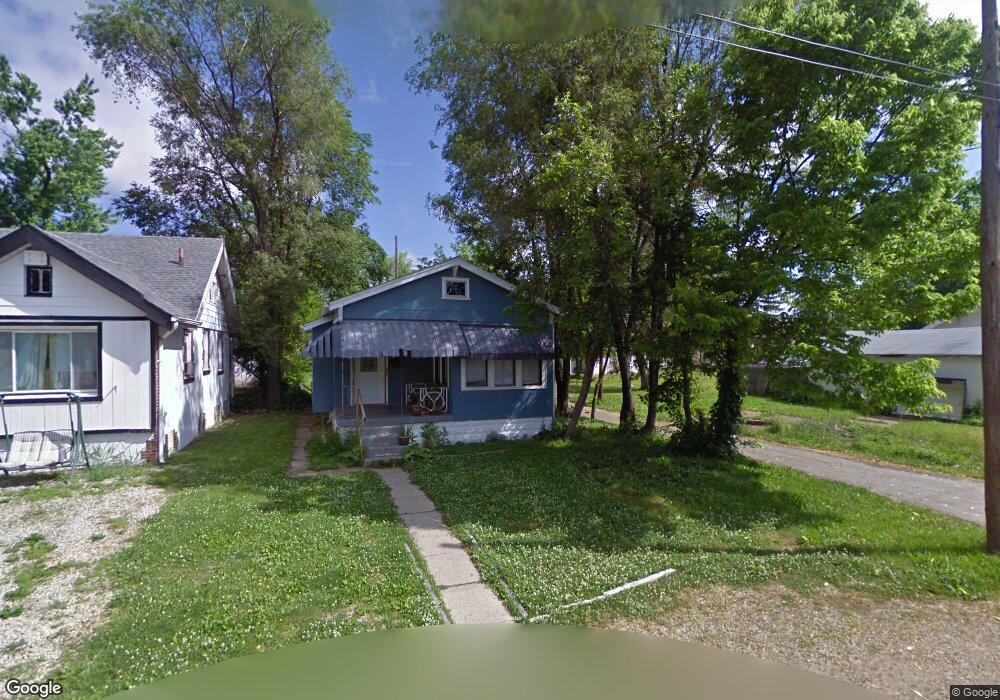
2106 Union Ave Columbus, OH 43223
South Hilltop NeighborhoodEstimated Value: $94,764 - $145,000
2
Beds
1
Bath
744
Sq Ft
$157/Sq Ft
Est. Value
About This Home
This home is located at 2106 Union Ave, Columbus, OH 43223 and is currently estimated at $116,941, approximately $157 per square foot. 2106 Union Ave is a home located in Franklin County with nearby schools including West Mound Elementary School, Hilltonia Middle School, and Briggs High School.
Ownership History
Date
Name
Owned For
Owner Type
Purchase Details
Closed on
Apr 29, 2008
Sold by
Us Bank Na
Bought by
Richards David and Richards Lucinda
Current Estimated Value
Purchase Details
Closed on
Jun 19, 2007
Sold by
Allen Michelle and Case #06Cve11 14458
Bought by
Wells Fargo Bank Na
Purchase Details
Closed on
Jan 26, 2006
Sold by
Decamp Steven and Decamp Tammy
Bought by
Allen William and Allen Michele
Home Financials for this Owner
Home Financials are based on the most recent Mortgage that was taken out on this home.
Original Mortgage
$63,900
Interest Rate
6.46%
Mortgage Type
Fannie Mae Freddie Mac
Purchase Details
Closed on
Mar 4, 2004
Sold by
Columbus Equities Corp
Bought by
Decamp Steven and Decamp Tammy
Home Financials for this Owner
Home Financials are based on the most recent Mortgage that was taken out on this home.
Original Mortgage
$300,000
Interest Rate
12%
Mortgage Type
Purchase Money Mortgage
Purchase Details
Closed on
Nov 16, 1983
Bought by
Columbus Equities Corp
Create a Home Valuation Report for This Property
The Home Valuation Report is an in-depth analysis detailing your home's value as well as a comparison with similar homes in the area
Home Values in the Area
Average Home Value in this Area
Purchase History
| Date | Buyer | Sale Price | Title Company |
|---|---|---|---|
| Richards David | $11,300 | None Available | |
| Us Bank Na | -- | Prism Title & Closing Servic | |
| Wells Fargo Bank Na | $28,000 | None Available | |
| Allen William | $71,000 | 21St Centu | |
| Decamp Steven | $162,000 | Independent Title | |
| Columbus Equities Corp | $18,000 | -- |
Source: Public Records
Mortgage History
| Date | Status | Borrower | Loan Amount |
|---|---|---|---|
| Previous Owner | Allen William | $63,900 | |
| Previous Owner | Decamp Steven | $300,000 |
Source: Public Records
Tax History Compared to Growth
Tax History
| Year | Tax Paid | Tax Assessment Tax Assessment Total Assessment is a certain percentage of the fair market value that is determined by local assessors to be the total taxable value of land and additions on the property. | Land | Improvement |
|---|---|---|---|---|
| 2024 | $1,224 | $26,710 | $5,670 | $21,040 |
| 2023 | $1,209 | $26,705 | $5,670 | $21,035 |
| 2022 | $698 | $13,130 | $2,070 | $11,060 |
| 2021 | $699 | $13,130 | $2,070 | $11,060 |
| 2020 | $700 | $13,130 | $2,070 | $11,060 |
| 2019 | $660 | $10,610 | $1,720 | $8,890 |
| 2018 | $764 | $10,610 | $1,720 | $8,890 |
| 2017 | $690 | $10,610 | $1,720 | $8,890 |
| 2016 | $900 | $13,240 | $4,660 | $8,580 |
| 2015 | $869 | $13,240 | $4,660 | $8,580 |
| 2014 | $821 | $13,240 | $4,660 | $8,580 |
| 2013 | $475 | $15,540 | $5,460 | $10,080 |
Source: Public Records
Map
Nearby Homes
- 485 Belvidere Ave
- 509 Belvidere Ave
- 2205-2207 Sullivant Ave
- 2188 Amherst Ave
- 599 Whitethorne Ave
- 2017-2019 Sullivant Ave
- 2169 Amherst Ave
- 2009 Sullivant Ave Unit 9
- 611 Whitethorne Ave
- 379 Midland Ave
- 365 Lechner Ave
- 329-331 Whitethorne Ave
- 479 Nashoba Ave
- 2264 Shelton St
- 353 Clarendon Ave
- 545-547 S Highland Ave Unit 545
- 1953 Sullivant Ave
- 597 Nashoba Ave
- 1921 Sullivant Ave
- 608 Nashoba Ave
- 2112 Union Ave
- 451 Belvidere Ave
- 467 Belvidere Ave
- 2122 Union Ave
- 0 Union St
- 2105 Sullivant Ave
- 2115 Sullivant Ave
- 2101 Sullivant Ave
- 477 Belvidere Ave
- 2119 Sullivant Ave Unit 119
- 2095 Sullivant Ave
- 2119 Union Ave
- 2125 Sullivant Ave
- 492 Butler Ave
- 2091 Sullivant Ave
- 2129 Sullivant Ave
- 478 Whitethorne Ave
- 470 Whitethorne Ave
- 474 Whitethorne Ave
- 2087 Sullivant Ave