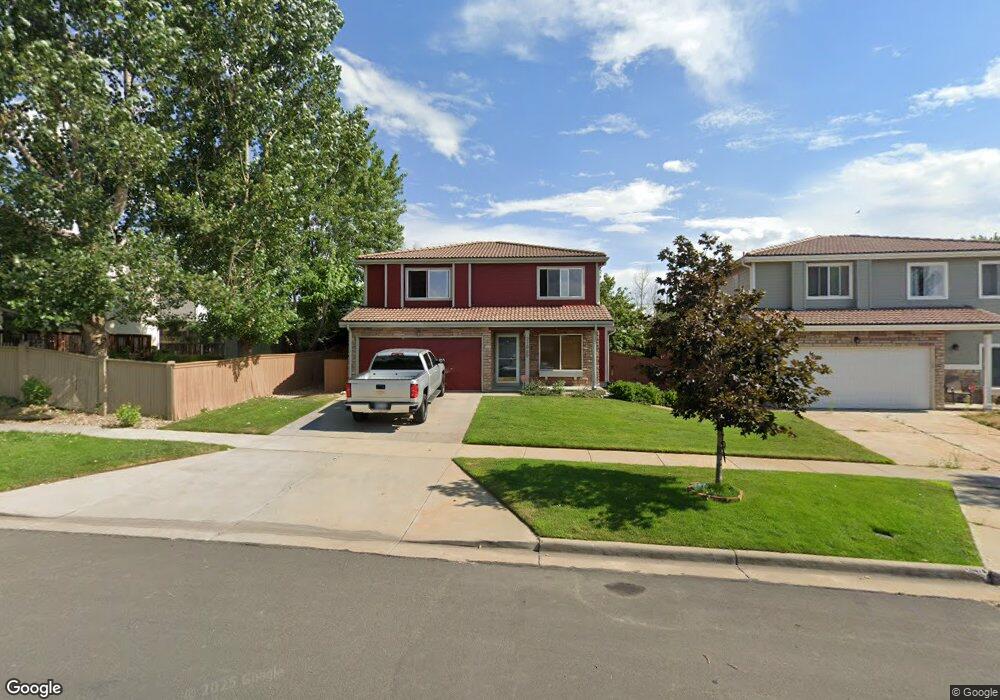
21060 E 40th Ave Denver, CO 80249
Green Valley Ranch NeighborhoodEstimated Value: $437,000 - $463,227
3
Beds
3
Baths
1,646
Sq Ft
$277/Sq Ft
Est. Value
About This Home
This home is located at 21060 E 40th Ave, Denver, CO 80249 and is currently estimated at $455,307, approximately $276 per square foot. 21060 E 40th Ave is a home located in Denver County with nearby schools including Green Valley Elementary School, Pitt-Waller K-8 School, and McGlone Academy.
Ownership History
Date
Name
Owned For
Owner Type
Purchase Details
Closed on
Mar 31, 2015
Sold by
Deines Debra
Bought by
Salomon Paulino
Current Estimated Value
Home Financials for this Owner
Home Financials are based on the most recent Mortgage that was taken out on this home.
Original Mortgage
$245,471
Outstanding Balance
$194,391
Interest Rate
4.87%
Mortgage Type
FHA
Estimated Equity
$260,916
Purchase Details
Closed on
Nov 2, 2007
Sold by
Sakamoto Bigham Madoka and Bigham Randy L
Bought by
Deines Debra
Home Financials for this Owner
Home Financials are based on the most recent Mortgage that was taken out on this home.
Original Mortgage
$173,280
Interest Rate
6.37%
Mortgage Type
FHA
Purchase Details
Closed on
Jul 11, 2001
Sold by
Oakwood Homes Llc
Bought by
Bigham Randy L and Sakamoto Bigham Madoka
Home Financials for this Owner
Home Financials are based on the most recent Mortgage that was taken out on this home.
Original Mortgage
$175,211
Interest Rate
7.18%
Mortgage Type
FHA
Create a Home Valuation Report for This Property
The Home Valuation Report is an in-depth analysis detailing your home's value as well as a comparison with similar homes in the area
Home Values in the Area
Average Home Value in this Area
Purchase History
| Date | Buyer | Sale Price | Title Company |
|---|---|---|---|
| Salomon Paulino | $250,000 | None Available | |
| Deines Debra | $176,000 | Chicago Title Co | |
| Bigham Randy L | $177,687 | Stewart Title | |
| Oakwood Homes Llc | -- | Stewart Title |
Source: Public Records
Mortgage History
| Date | Status | Borrower | Loan Amount |
|---|---|---|---|
| Open | Salomon Paulino | $245,471 | |
| Previous Owner | Deines Debra | $173,280 | |
| Previous Owner | Bigham Randy L | $175,211 |
Source: Public Records
Tax History
| Year | Tax Paid | Tax Assessment Tax Assessment Total Assessment is a certain percentage of the fair market value that is determined by local assessors to be the total taxable value of land and additions on the property. | Land | Improvement |
|---|---|---|---|---|
| 2025 | $2,811 | $32,750 | $6,520 | $6,520 |
| 2024 | $2,811 | $29,810 | $2,510 | $27,300 |
| 2023 | $2,668 | $29,810 | $2,510 | $27,300 |
| 2022 | $2,478 | $24,870 | $5,140 | $19,730 |
| 2021 | $2,424 | $25,590 | $5,290 | $20,300 |
| 2020 | $2,218 | $23,520 | $4,400 | $19,120 |
| 2019 | $2,169 | $23,520 | $4,400 | $19,120 |
| 2018 | $1,940 | $19,910 | $3,550 | $16,360 |
| 2017 | $1,936 | $19,910 | $3,550 | $16,360 |
| 2016 | $1,646 | $16,190 | $3,439 | $12,751 |
| 2015 | $1,590 | $16,190 | $3,439 | $12,751 |
| 2014 | $1,087 | $10,540 | $2,388 | $8,152 |
Source: Public Records
Map
Nearby Homes
- 3974 Malta St
- 4096 Netherland St
- 4060 Orleans St
- 21300 E 42nd Ave
- 4087 Orleans Ct
- 4116 Orleans St
- 4125 Orleans Ct
- 21480 E 42nd Ave
- 4250 Perth Cir
- 4315 Orleans St
- 20604 E 38th Place
- 4312 Kirk Ct
- 3880 N Jebel St
- 21982 E 38th Place
- 20372 E 40th Place
- 20927 Kelly Place
- 4074 Picadilly Ct
- 4073 N Quatar Ct
- 3934 N Quatar Ct
- 20420 Kelly Place
- 21040 E 40th Ave
- 3995 Malta St
- 3985 Malta St
- 3973 Malaya Ct
- 21020 E 40th Ave
- 3975 Malta St
- 3972 Malaya Ct
- 3952 Malaya Ct
- 3955 Malta St
- 21041 E 40th Ave
- 21021 E 40th Ave
- 21051 E 40th Ave
- 3953 Malaya Ct
- 21061 E 40th Ave
- 3990 Malaya St
- 3945 Malta St
- 21011 E 40th Ave
- 3994 Malta St
- 3922 Malaya Ct
- 3980 Malaya St
Your Personal Tour Guide
Ask me questions while you tour the home.