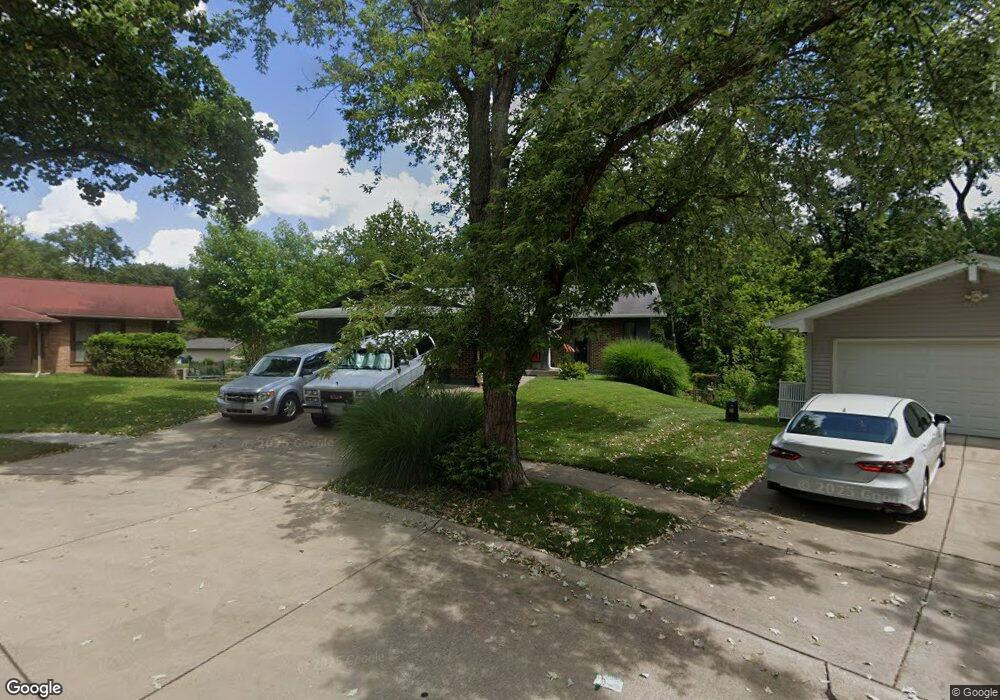
2107 Cherrycove Ct Maryland Heights, MO 63043
Estimated Value: $335,000 - $347,000
3
Beds
2
Baths
1,134
Sq Ft
$299/Sq Ft
Est. Value
About This Home
This home is located at 2107 Cherrycove Ct, Maryland Heights, MO 63043 and is currently estimated at $338,778, approximately $298 per square foot. 2107 Cherrycove Ct is a home located in St. Louis County with nearby schools including McKelvey Elementary School, Parkway Northeast Middle School, and Parkway North High School.
Ownership History
Date
Name
Owned For
Owner Type
Purchase Details
Closed on
Feb 17, 2022
Sold by
Frye Michael
Bought by
Frye Michael
Current Estimated Value
Home Financials for this Owner
Home Financials are based on the most recent Mortgage that was taken out on this home.
Original Mortgage
$107,041
Outstanding Balance
$99,396
Interest Rate
3.55%
Mortgage Type
FHA
Estimated Equity
$239,382
Purchase Details
Closed on
Jun 17, 2008
Sold by
Frye Michael and Frye Katharine
Bought by
Frye Michael
Home Financials for this Owner
Home Financials are based on the most recent Mortgage that was taken out on this home.
Original Mortgage
$181,685
Interest Rate
6.11%
Mortgage Type
Stand Alone Refi Refinance Of Original Loan
Purchase Details
Closed on
Sep 25, 2002
Sold by
Frye Robert M and Frye Kathryn M
Bought by
Frye Michael and Frye Katharine
Home Financials for this Owner
Home Financials are based on the most recent Mortgage that was taken out on this home.
Original Mortgage
$137,600
Interest Rate
6.2%
Create a Home Valuation Report for This Property
The Home Valuation Report is an in-depth analysis detailing your home's value as well as a comparison with similar homes in the area
Home Values in the Area
Average Home Value in this Area
Purchase History
| Date | Buyer | Sale Price | Title Company |
|---|---|---|---|
| Frye Michael | -- | Chesterfield Title Agency | |
| Frye Michael | -- | None Available | |
| Frye Michael | $137,600 | -- |
Source: Public Records
Mortgage History
| Date | Status | Borrower | Loan Amount |
|---|---|---|---|
| Open | Frye Michael | $107,041 | |
| Previous Owner | Frye Michael | $181,685 | |
| Previous Owner | Frye Michael | $137,600 |
Source: Public Records
Tax History Compared to Growth
Tax History
| Year | Tax Paid | Tax Assessment Tax Assessment Total Assessment is a certain percentage of the fair market value that is determined by local assessors to be the total taxable value of land and additions on the property. | Land | Improvement |
|---|---|---|---|---|
| 2025 | $3,715 | $54,950 | $13,550 | $41,400 |
| 2024 | $3,715 | $52,010 | $11,290 | $40,720 |
| 2023 | $3,715 | $52,010 | $11,290 | $40,720 |
| 2022 | $3,702 | $47,850 | $11,290 | $36,560 |
| 2021 | $3,737 | $47,850 | $11,290 | $36,560 |
| 2020 | $3,141 | $40,510 | $14,760 | $25,750 |
| 2019 | $3,102 | $40,510 | $14,760 | $25,750 |
| 2018 | $2,884 | $34,670 | $9,800 | $24,870 |
| 2017 | $2,852 | $34,670 | $9,800 | $24,870 |
| 2016 | $2,708 | $31,350 | $7,540 | $23,810 |
| 2015 | $2,828 | $31,350 | $7,540 | $23,810 |
| 2014 | $2,561 | $31,030 | $7,280 | $23,750 |
Source: Public Records
Map
Nearby Homes
- 2234 Arborview Dr
- 2041 Falling Brook Dr
- 2229 Murray Forest Dr
- 11932 Ameling Rd
- 11916 Meadowpark Ct
- 1827 Pheasant Run Dr
- 11833 McKelvey Gardens Dr
- 12201 Dr
- 2213 Rule Ave
- 2 Nottingham at Louiselle Park
- 2 Aspen II
- 2 Hermitage II at Louiselle Park
- 2 Ashford at Louiselle Park
- 12241 Rain Hollow Dr
- 2427 Pheasant Run Dr
- 2 Sequoia at Louiselle Park
- 2 Sterling at Louiselle Park
- 2444 Pheasant Run Dr
- 2 Pin Oak at Louiselle Park
- 2 Royal II at Louiselle Park
- 2111 Cherrycove Ct
- 2103 Cherrycove Ct
- 2113 Cherrycove Ct
- 2102 Cherrycove Ct
- 2102 Cherry Cove Ct
- 2105 Butterfield Ct
- 2117 Cherrycove Ct
- 2112 Cherrycove Ct
- 2101 Butterfield Ct
- 2106 Cherrycove Ct
- 2109 Butterfield Ct
- 2114 Cherrycove Ct
- 2121 Cherrycove Ct
- 2100 Butterfield Ct
- 2115 Butterfield Ct
- 2122 Cherrycove Ct
- 2125 Cherrycove Ct
- 2119 Butterfield Ct
- 12022 Foxpoint Dr
- 12026 Foxpoint Dr