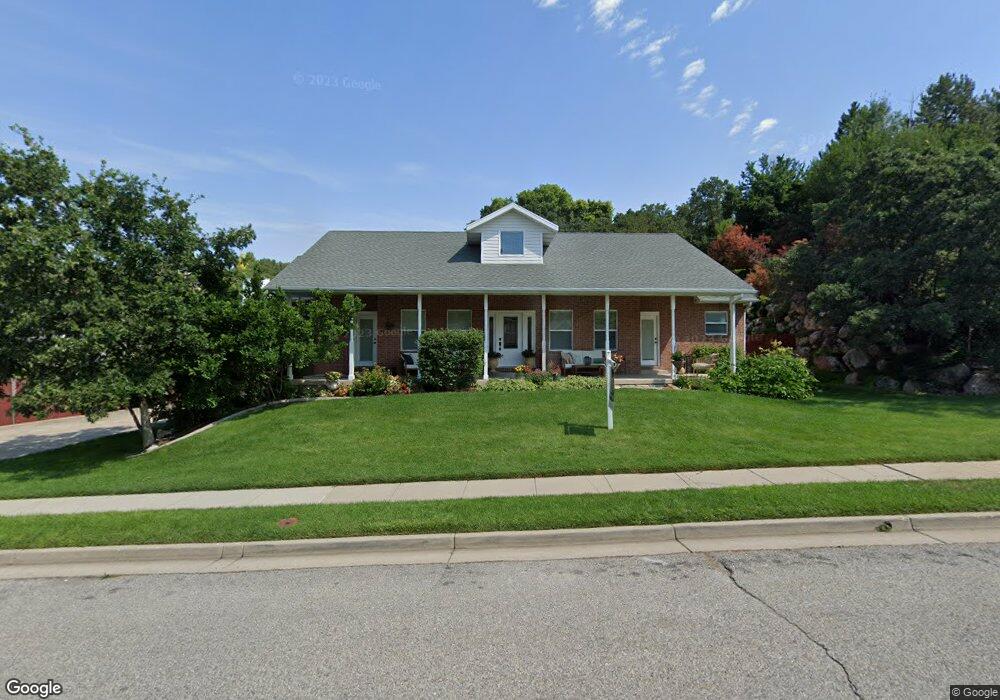
2107 Kays Creek Dr Layton, UT 84040
Estimated Value: $630,000 - $806,000
4
Beds
3
Baths
3,522
Sq Ft
$200/Sq Ft
Est. Value
About This Home
This home is located at 2107 Kays Creek Dr, Layton, UT 84040 and is currently estimated at $703,363, approximately $199 per square foot. 2107 Kays Creek Dr is a home located in Davis County with nearby schools including East Layton Elementary School, Central Davis Junior High School, and Northridge High School.
Ownership History
Date
Name
Owned For
Owner Type
Purchase Details
Closed on
Sep 15, 2023
Sold by
Tracy V Rypien Revocable Trust
Bought by
Townsend Luke Alan and Townsend Jessica
Current Estimated Value
Home Financials for this Owner
Home Financials are based on the most recent Mortgage that was taken out on this home.
Original Mortgage
$75,000
Outstanding Balance
$73,569
Interest Rate
7.75%
Mortgage Type
New Conventional
Estimated Equity
$629,794
Purchase Details
Closed on
Dec 17, 2010
Sold by
Rypien Tracy V
Bought by
Rypien Tracy and The Tracy V Rypien Revocable Trust
Home Financials for this Owner
Home Financials are based on the most recent Mortgage that was taken out on this home.
Original Mortgage
$228,413
Interest Rate
3.56%
Mortgage Type
New Conventional
Create a Home Valuation Report for This Property
The Home Valuation Report is an in-depth analysis detailing your home's value as well as a comparison with similar homes in the area
Home Values in the Area
Average Home Value in this Area
Purchase History
| Date | Buyer | Sale Price | Title Company |
|---|---|---|---|
| Townsend Luke Alan | -- | Stewart Title | |
| Rypien Tracy | -- | Surety Title Agency |
Source: Public Records
Mortgage History
| Date | Status | Borrower | Loan Amount |
|---|---|---|---|
| Open | Townsend Luke Alan | $75,000 | |
| Previous Owner | Rypien Tracy | $228,413 |
Source: Public Records
Tax History Compared to Growth
Tax History
| Year | Tax Paid | Tax Assessment Tax Assessment Total Assessment is a certain percentage of the fair market value that is determined by local assessors to be the total taxable value of land and additions on the property. | Land | Improvement |
|---|---|---|---|---|
| 2025 | $3,443 | $333,300 | $151,277 | $182,023 |
| 2024 | $3,276 | $321,750 | $169,803 | $151,947 |
| 2023 | $3,156 | $551,000 | $218,596 | $332,404 |
| 2022 | $3,225 | $307,450 | $118,147 | $189,303 |
| 2021 | $3,079 | $438,000 | $181,247 | $256,753 |
| 2020 | $2,805 | $382,000 | $152,603 | $229,397 |
| 2019 | $2,722 | $365,000 | $135,040 | $229,960 |
| 2018 | $2,519 | $339,000 | $109,803 | $229,197 |
| 2016 | $2,440 | $172,590 | $71,764 | $100,826 |
| 2015 | $2,337 | $157,685 | $71,764 | $85,921 |
| 2014 | $2,365 | $164,286 | $71,764 | $92,522 |
| 2013 | -- | $156,745 | $37,846 | $118,899 |
Source: Public Records
Map
Nearby Homes
- 2411 Kays Creek Dr
- 1522 N 2200 E
- 2011 Dan Dr
- 1975 E 1425 N
- 2345 E Cherry Ln
- 2141 E Oak Ln Unit 5
- 2316 E 1975 N
- 1332 N 2350 E
- 1657 E Cherry Ln
- 1204 N 1875 E Unit 5
- 1735 Hayes Dr
- 1148 N 1875 E Unit 2
- 1283 N 2575 E
- 2202 N 2300 E
- 1463 Kays Creek Dr
- 1262 N 2575 E
- 2273 N 1975 E
- Richards Plan at Eastridge Park - The Vistas
- Brynlee Plan at Eastridge Park - The Vistas
- Brynlee Plan at Eastridge Park - The Heights
- 1300 Kays Creek Dr Unit 13
- 1658 Oak Ln
- 2131 Kays Creek Dr
- 1646 Oak Ln
- 2110 Kays Creek Dr
- 2092 Kays Creek Dr
- 2156 Country Oaks Dr
- 1677 Oak Ln
- 1677 Oak Ln
- 2153 Kays Creek Dr
- 2134 Kays Creek Dr
- 2080 Kays Creek Dr
- 2160 Country Oaks Dr
- 2068 Kays Creek Dr
- 2073 Cherry Meadows Ln
- 2079 Cherry Meadows Ln
- 2079 Cherry Meadows Ln Unit 129
- 2152 Country Oaks Dr
- 2171 Kays Creek Dr
- 2061 Cherry Meadows Ln