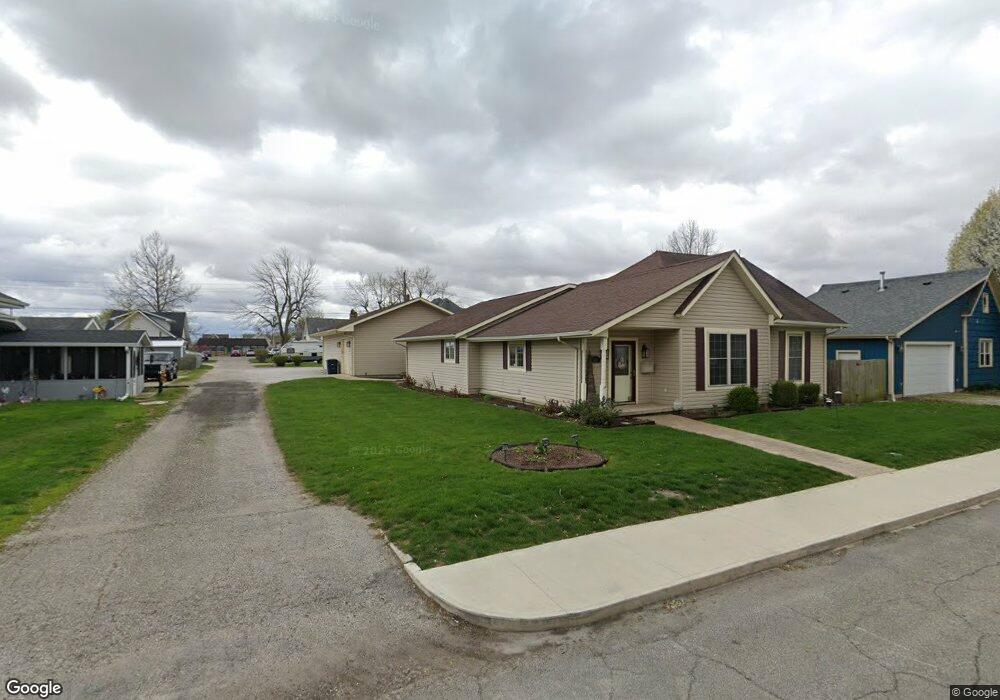
2107 N A St Elwood, IN 46036
Estimated Value: $158,000 - $210,514
3
Beds
1
Bath
1,342
Sq Ft
$139/Sq Ft
Est. Value
About This Home
This home is located at 2107 N A St, Elwood, IN 46036 and is currently estimated at $186,629, approximately $139 per square foot. 2107 N A St is a home located in Madison County with nearby schools including Elwood Elementary School, Elwood Intermediate School, and Elwood Junior-Senior High School.
Ownership History
Date
Name
Owned For
Owner Type
Purchase Details
Closed on
Jun 24, 2019
Sold by
Horning Kenneth L and Horning Wanda L
Bought by
Abernathy David and Abernathy Barbara J
Current Estimated Value
Home Financials for this Owner
Home Financials are based on the most recent Mortgage that was taken out on this home.
Original Mortgage
$49,900
Outstanding Balance
$43,600
Interest Rate
4%
Mortgage Type
New Conventional
Estimated Equity
$143,029
Create a Home Valuation Report for This Property
The Home Valuation Report is an in-depth analysis detailing your home's value as well as a comparison with similar homes in the area
Home Values in the Area
Average Home Value in this Area
Purchase History
| Date | Buyer | Sale Price | Title Company |
|---|---|---|---|
| Abernathy David | -- | Fidelity National Title |
Source: Public Records
Mortgage History
| Date | Status | Borrower | Loan Amount |
|---|---|---|---|
| Open | Abernathy David | $49,900 |
Source: Public Records
Tax History Compared to Growth
Tax History
| Year | Tax Paid | Tax Assessment Tax Assessment Total Assessment is a certain percentage of the fair market value that is determined by local assessors to be the total taxable value of land and additions on the property. | Land | Improvement |
|---|---|---|---|---|
| 2025 | $1,293 | $129,300 | $11,100 | $118,200 |
| 2024 | $1,293 | $129,300 | $11,100 | $118,200 |
| 2023 | $1,195 | $117,900 | $10,600 | $107,300 |
| 2022 | $1,173 | $117,100 | $9,800 | $107,300 |
| 2021 | $1,032 | $104,000 | $9,600 | $94,400 |
| 2020 | $617 | $61,500 | $8,900 | $52,600 |
| 2019 | $10 | $60,000 | $8,900 | $51,100 |
| 2018 | $10 | $57,000 | $8,900 | $48,100 |
| 2017 | $0 | $56,400 | $8,900 | $47,500 |
| 2016 | $10 | $53,900 | $8,700 | $45,200 |
| 2014 | -- | $55,000 | $8,900 | $46,100 |
| 2013 | -- | $55,000 | $8,900 | $46,100 |
Source: Public Records
Map
Nearby Homes