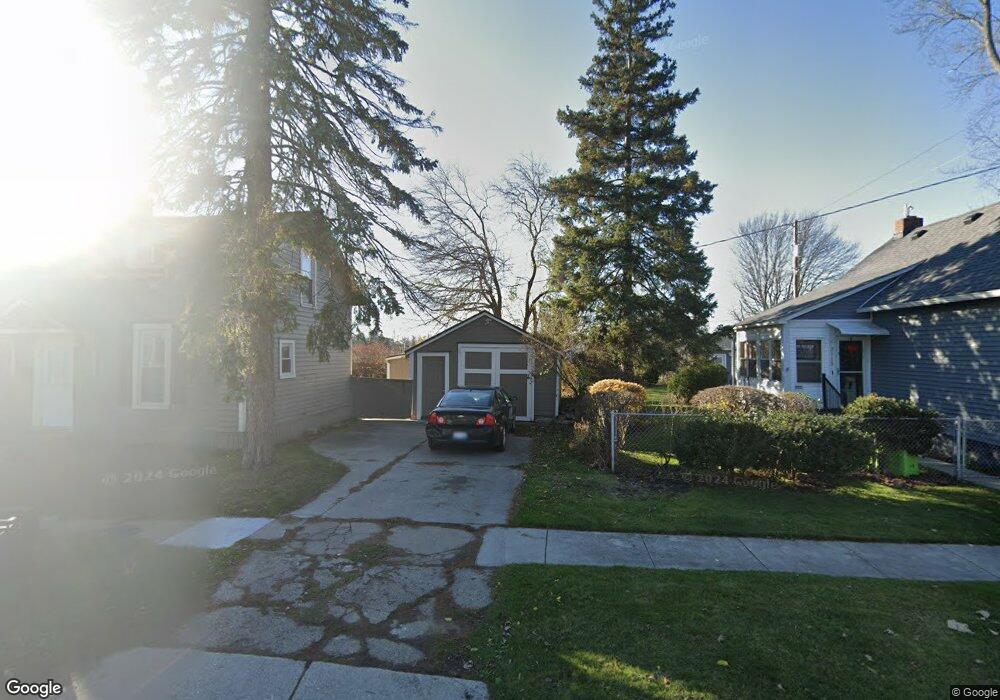
2107 Poplar St Port Huron, MI 48060
Estimated Value: $82,000 - $161,000
2
Beds
1
Bath
600
Sq Ft
$185/Sq Ft
Est. Value
About This Home
This home is located at 2107 Poplar St, Port Huron, MI 48060 and is currently estimated at $111,212, approximately $185 per square foot. 2107 Poplar St is a home located in St. Clair County with nearby schools including H.D. Crull Elementary School, Holland Woods Middle School, and Port Huron Northern High School.
Ownership History
Date
Name
Owned For
Owner Type
Purchase Details
Closed on
Mar 31, 2023
Sold by
Schock Gerald E and Schock Marianne A
Bought by
Fagan Investment Llc
Current Estimated Value
Home Financials for this Owner
Home Financials are based on the most recent Mortgage that was taken out on this home.
Original Mortgage
$63,000
Outstanding Balance
$61,157
Interest Rate
6.32%
Mortgage Type
New Conventional
Estimated Equity
$50,055
Purchase Details
Closed on
Aug 1, 2022
Sold by
Schock Gerald E and Schock Marianne A
Bought by
Fagan Investment Llc
Purchase Details
Closed on
Dec 12, 2016
Sold by
Schock Gerald E and Schock Marianne A
Bought by
Schock Gerald E and Schock Marianne A
Purchase Details
Closed on
Apr 28, 2009
Sold by
E & A Credit Union
Bought by
Schock Gerald E and Schock Marianne A
Purchase Details
Closed on
Aug 28, 2008
Sold by
Hauler Christopher J
Bought by
E & A Credit Union
Create a Home Valuation Report for This Property
The Home Valuation Report is an in-depth analysis detailing your home's value as well as a comparison with similar homes in the area
Home Values in the Area
Average Home Value in this Area
Purchase History
| Date | Buyer | Sale Price | Title Company |
|---|---|---|---|
| Fagan Investment Llc | $60,000 | Ata National Title | |
| Fagan Investment Llc | -- | Liberty Title | |
| Fagan Investment Llc | -- | Liberty Title | |
| Schock Gerald E | -- | None Available | |
| Schock Gerald E | $10,000 | Sky Title Agency | |
| E & A Credit Union | $17,675 | None Available |
Source: Public Records
Mortgage History
| Date | Status | Borrower | Loan Amount |
|---|---|---|---|
| Open | Fagan Investment Llc | $63,000 |
Source: Public Records
Tax History Compared to Growth
Tax History
| Year | Tax Paid | Tax Assessment Tax Assessment Total Assessment is a certain percentage of the fair market value that is determined by local assessors to be the total taxable value of land and additions on the property. | Land | Improvement |
|---|---|---|---|---|
| 2025 | $4,251 | $37,600 | $0 | $0 |
| 2024 | $1,976 | $34,900 | $0 | $0 |
| 2023 | $1,871 | $30,900 | $0 | $0 |
| 2022 | $947 | $26,400 | $0 | $0 |
| 2021 | $905 | $24,600 | $0 | $0 |
| 2020 | $909 | $22,900 | $22,900 | $0 |
| 2019 | $893 | $15,700 | $0 | $0 |
| 2018 | $873 | $15,700 | $0 | $0 |
| 2017 | $850 | $14,800 | $0 | $0 |
| 2016 | $702 | $14,800 | $0 | $0 |
| 2015 | $689 | $13,400 | $13,400 | $0 |
| 2014 | $689 | $12,800 | $12,800 | $0 |
| 2013 | -- | $12,800 | $0 | $0 |
Source: Public Records
Map
Nearby Homes
- 2400 Stone St Unit 2414
- 1116 Hancock St
- 2419 Cherry St
- 1620 McBrady St
- 1649 Whipple St
- 1907 Riverside Dr
- 2431 Armour St
- 1433 Poplar St
- 1733 Whipple St
- 1819 Riverside Dr
- 2215 Hancock St
- 2913 11th Ave
- 1531 Robinson St
- 2736 17th Ave
- 1202 Palmer Ct
- 1417 Kearney St
- 2925 Linda Ct
- 2812 19th Ave
- 0000 Campau Ave
- 1828 Kennelworth Dr
- 1307 Mansfield St
- 0 Poplar St
- 2033 Poplar St
- 1217 Mansfield St
- 2115 Poplar St
- 2108 Poplar St
- 2029 Poplar St
- 1213 Mansfield St
- 2116 Poplar St
- 2121 Poplar St
- 2025 Poplar St
- 2116 10th Ave
- 2103 Elk St
- 1318 Mansfield St
- 2120 Poplar St
- 2034 Poplar St
- 2026 Poplar St
- 2030 Poplar St
- 2021 Poplar St
- 2109 Elk St