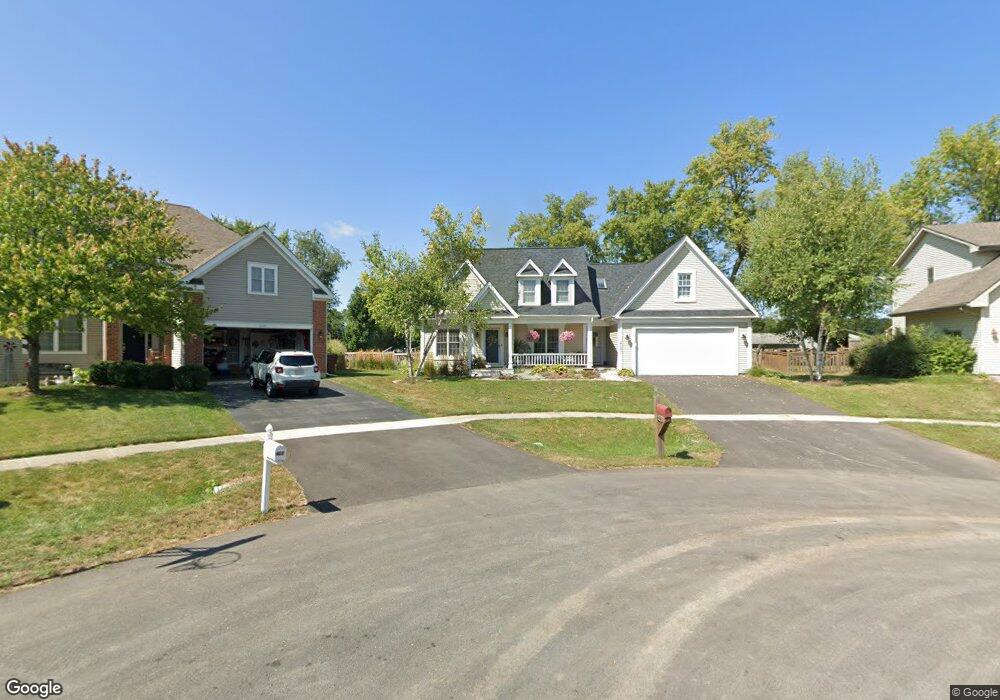
2107 Red Barn Ct Woodstock, IL 60098
Estimated Value: $381,000 - $402,000
3
Beds
5
Baths
2,198
Sq Ft
$180/Sq Ft
Est. Value
About This Home
This home is located at 2107 Red Barn Ct, Woodstock, IL 60098 and is currently estimated at $395,161, approximately $179 per square foot. 2107 Red Barn Ct is a home located in McHenry County with nearby schools including Olson Elementary School, Creekside Middle School, and Woodstock High School.
Ownership History
Date
Name
Owned For
Owner Type
Purchase Details
Closed on
Nov 12, 2004
Sold by
Stuart Timothy S and Stuart Deborah B
Bought by
Behrens Donald J and Behrens Kimberly J
Current Estimated Value
Home Financials for this Owner
Home Financials are based on the most recent Mortgage that was taken out on this home.
Original Mortgage
$208,000
Outstanding Balance
$103,937
Interest Rate
5.8%
Mortgage Type
Unknown
Estimated Equity
$291,224
Purchase Details
Closed on
Sep 13, 2001
Sold by
Wallis Gregory J and Wallis Angela C
Bought by
Stuart Timothy S and Stuart Deborah B
Home Financials for this Owner
Home Financials are based on the most recent Mortgage that was taken out on this home.
Original Mortgage
$184,900
Interest Rate
6.5%
Purchase Details
Closed on
Oct 31, 1995
Sold by
Mc Connell Road Ltd Partnership
Bought by
Walls Gregory J and Walls Angela C
Home Financials for this Owner
Home Financials are based on the most recent Mortgage that was taken out on this home.
Original Mortgage
$30,000
Interest Rate
7.61%
Create a Home Valuation Report for This Property
The Home Valuation Report is an in-depth analysis detailing your home's value as well as a comparison with similar homes in the area
Home Values in the Area
Average Home Value in this Area
Purchase History
| Date | Buyer | Sale Price | Title Company |
|---|---|---|---|
| Behrens Donald J | $263,500 | Ut | |
| Stuart Timothy S | $224,900 | -- | |
| Walls Gregory J | $42,000 | -- |
Source: Public Records
Mortgage History
| Date | Status | Borrower | Loan Amount |
|---|---|---|---|
| Open | Behrens Donald J | $208,000 | |
| Previous Owner | Stuart Timothy S | $184,900 | |
| Previous Owner | Walls Gregory J | $30,000 | |
| Closed | Walls Gregory J | $30,000 |
Source: Public Records
Tax History Compared to Growth
Tax History
| Year | Tax Paid | Tax Assessment Tax Assessment Total Assessment is a certain percentage of the fair market value that is determined by local assessors to be the total taxable value of land and additions on the property. | Land | Improvement |
|---|---|---|---|---|
| 2024 | $10,460 | $113,528 | $14,368 | $99,160 |
| 2023 | $10,043 | $102,666 | $12,993 | $89,673 |
| 2022 | $9,394 | $91,113 | $11,531 | $79,582 |
| 2021 | $8,984 | $85,129 | $10,774 | $74,355 |
| 2020 | $8,046 | $80,891 | $10,238 | $70,653 |
| 2019 | $7,813 | $77,216 | $9,773 | $67,443 |
| 2018 | $7,666 | $74,774 | $11,148 | $63,626 |
| 2017 | $7,529 | $70,375 | $10,492 | $59,883 |
| 2016 | $7,758 | $67,472 | $9,715 | $57,757 |
| 2013 | -- | $57,043 | $8,335 | $48,708 |
Source: Public Records
Map
Nearby Homes
- 2101 Red Barn Ct
- 2019 Aspen Dr
- 2108 Aspen Dr
- 2021 Aspen Dr
- lot 1 Mcconnell Rd
- Lot 5 Olmstead Dr
- Lot 2 Olmstead Dr
- 2101 Preswick Ln
- 2525 Applewood Ln
- 1026 Heron Way
- Lot 13 Duncan Place
- 1624 Bull Valley Dr
- 12 Duncan Place
- 1551 Bobolink Cir
- 1601 Bobolink Cir
- Lot #23 Ridgemoor Trail
- Lot #22 Ridgemoor Trail
- Lot #21 Ridgemoor Trail
- LOT 7 Dillard Ct
- Lot #34 W Longwood Dr
- 2109 Red Barn Ct
- 2105 Red Barn Ct
- 2113 Red Barn Ct
- 2002 Aspen Dr
- 2110 Red Barn Ct
- 2104 Red Barn Ct
- 00000 Mcconnell Rd
- 2108 Red Barn Ct
- 2003 Aspen Dr
- 2100 Red Barn Ct
- 2004 Aspen Dr
- 2000 Aspen Dr
- 2001 Aspen Dr
- 2013 Red Barn Rd
- 2006 Aspen Dr
- 2005 Aspen Dr
- 2036 Red Barn Rd
- 2032 Red Barn Rd
- 2009 Red Barn Rd
- 2028 Red Barn Rd