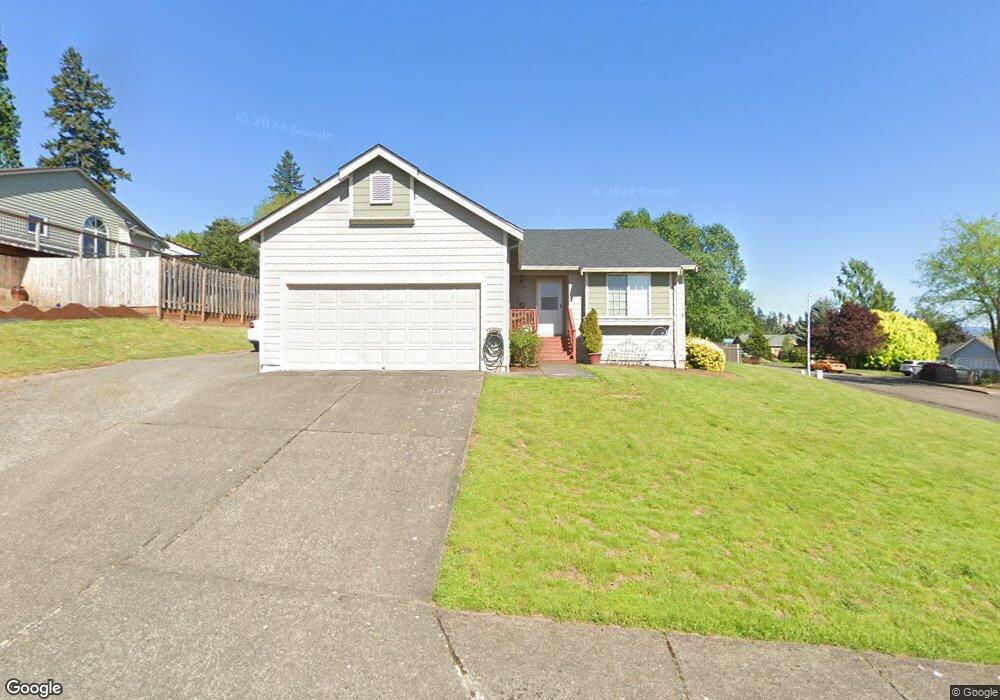
2108 38th Ct Washougal, WA 98671
Estimated Value: $509,126 - $554,000
3
Beds
2
Baths
1,661
Sq Ft
$322/Sq Ft
Est. Value
About This Home
This home is located at 2108 38th Ct, Washougal, WA 98671 and is currently estimated at $534,532, approximately $321 per square foot. 2108 38th Ct is a home located in Clark County with nearby schools including Gause Elementary School, Jemtegaard Middle School, and Washougal High School.
Ownership History
Date
Name
Owned For
Owner Type
Purchase Details
Closed on
Aug 3, 2016
Sold by
Schubel Joan E
Bought by
Schubel Joan E
Current Estimated Value
Purchase Details
Closed on
Jul 1, 1999
Sold by
Schubel William G and Schubel Patricia J
Bought by
Schubel Lyn G and Schubel Joan E
Purchase Details
Closed on
May 22, 1996
Sold by
Grant Homes Inc
Bought by
Schubel Lyn G and Schubel Joan E
Home Financials for this Owner
Home Financials are based on the most recent Mortgage that was taken out on this home.
Original Mortgage
$90,350
Interest Rate
7.97%
Mortgage Type
Seller Take Back
Create a Home Valuation Report for This Property
The Home Valuation Report is an in-depth analysis detailing your home's value as well as a comparison with similar homes in the area
Home Values in the Area
Average Home Value in this Area
Purchase History
| Date | Buyer | Sale Price | Title Company |
|---|---|---|---|
| Schubel Joan E | -- | Cascade Title Of Clark Cnty | |
| Schubel Lyn G | -- | First American Title Ins Co | |
| Schubel Lyn G | $108,000 | -- |
Source: Public Records
Mortgage History
| Date | Status | Borrower | Loan Amount |
|---|---|---|---|
| Previous Owner | Schubel Lyn G | $90,350 |
Source: Public Records
Tax History Compared to Growth
Tax History
| Year | Tax Paid | Tax Assessment Tax Assessment Total Assessment is a certain percentage of the fair market value that is determined by local assessors to be the total taxable value of land and additions on the property. | Land | Improvement |
|---|---|---|---|---|
| 2025 | $3,992 | $414,602 | $120,000 | $294,602 |
| 2024 | $3,922 | $420,670 | $144,000 | $276,670 |
| 2023 | $3,824 | $432,448 | $154,800 | $277,648 |
| 2022 | $3,812 | $412,909 | $154,800 | $258,109 |
| 2021 | $3,710 | $357,289 | $132,000 | $225,289 |
| 2020 | $3,576 | $326,317 | $120,000 | $206,317 |
| 2019 | $3,227 | $319,494 | $120,000 | $199,494 |
| 2018 | $3,447 | $304,817 | $0 | $0 |
| 2017 | $2,980 | $268,794 | $0 | $0 |
| 2016 | $2,882 | $255,169 | $0 | $0 |
| 2015 | $2,751 | $225,703 | $0 | $0 |
| 2014 | -- | $214,310 | $0 | $0 |
| 2013 | -- | $188,418 | $0 | $0 |
Source: Public Records
Map
Nearby Homes