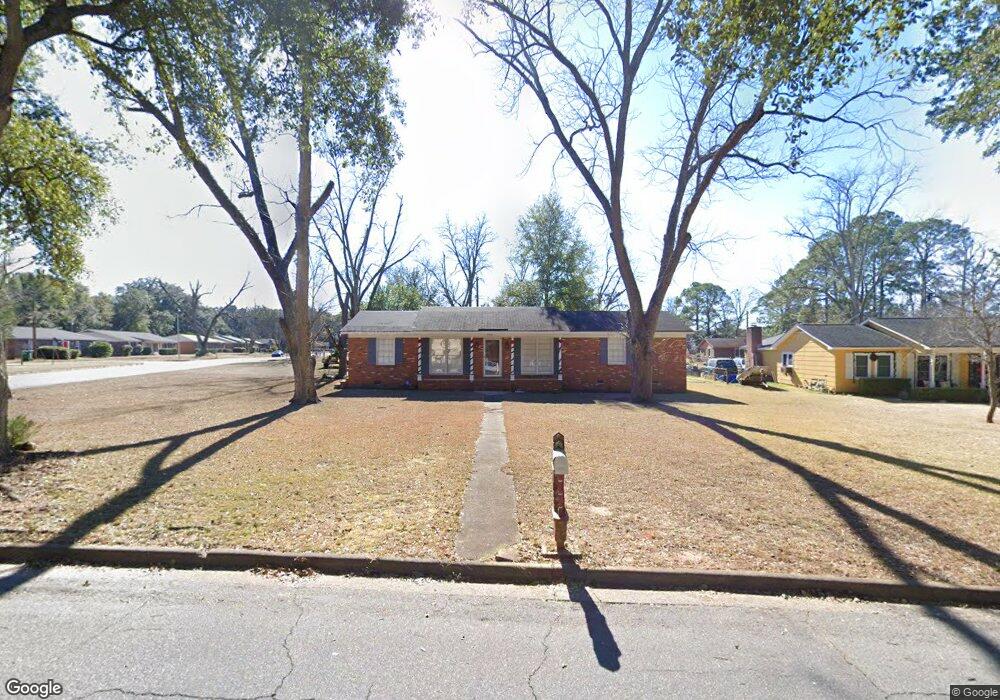
2108 Colquitt Ave Albany, GA 31707
Estimated Value: $99,000 - $136,208
3
Beds
2
Baths
1,475
Sq Ft
$82/Sq Ft
Est. Value
About This Home
This home is located at 2108 Colquitt Ave, Albany, GA 31707 and is currently estimated at $120,802, approximately $81 per square foot. 2108 Colquitt Ave is a home located in Dougherty County with nearby schools including West Town Elementary School, Southside Middle School, and Monroe High School.
Ownership History
Date
Name
Owned For
Owner Type
Purchase Details
Closed on
Mar 2, 2022
Sold by
Polite Mary A
Bought by
Davis Joyce Polite
Current Estimated Value
Purchase Details
Closed on
Aug 24, 2011
Sold by
Secretary Of Veterans Affairs
Bought by
Polite Mary
Purchase Details
Closed on
Mar 1, 2011
Sold by
Wells Fargo Bank Na
Bought by
Secretary Of Veterans Affairs
Purchase Details
Closed on
Nov 3, 2000
Sold by
Burks Andrewl and Burks Beverly J
Bought by
Ross Charlie J
Purchase Details
Closed on
Jun 7, 2000
Sold by
Williams Margaret M By Atty In Fact
Bought by
Burks Beverly J and Burks Andrew L
Purchase Details
Closed on
May 2, 1997
Sold by
Burks Beverly J and Burks Andrew L
Bought by
Williams Margaret M
Purchase Details
Closed on
Jul 26, 1993
Sold by
Battle Deborah A
Bought by
Burks Beverly J and Burks Andrew L
Purchase Details
Closed on
Nov 10, 1976
Sold by
Hazel Tommy W
Bought by
Battle Deborah A
Create a Home Valuation Report for This Property
The Home Valuation Report is an in-depth analysis detailing your home's value as well as a comparison with similar homes in the area
Home Values in the Area
Average Home Value in this Area
Purchase History
| Date | Buyer | Sale Price | Title Company |
|---|---|---|---|
| Davis Joyce Polite | -- | -- | |
| Polite Mary | -- | -- | |
| Secretary Of Veterans Affairs | $53,575 | -- | |
| Wells Fargo Bank Na | $53,575 | -- | |
| Ross Charlie J | $62,000 | -- | |
| Burks Beverly J | $67,500 | -- | |
| Williams Margaret M | $62,000 | -- | |
| Burks Beverly J | $46,000 | -- | |
| Battle Deborah A | -- | -- |
Source: Public Records
Tax History Compared to Growth
Tax History
| Year | Tax Paid | Tax Assessment Tax Assessment Total Assessment is a certain percentage of the fair market value that is determined by local assessors to be the total taxable value of land and additions on the property. | Land | Improvement |
|---|---|---|---|---|
| 2024 | $1,578 | $33,080 | $7,000 | $26,080 |
| 2023 | $1,541 | $33,080 | $7,000 | $26,080 |
| 2022 | $1,547 | $33,080 | $7,000 | $26,080 |
| 2021 | $1,434 | $33,080 | $7,000 | $26,080 |
| 2020 | $1,438 | $33,080 | $7,000 | $26,080 |
| 2019 | $1,443 | $33,080 | $7,000 | $26,080 |
| 2018 | $1,449 | $33,080 | $7,000 | $26,080 |
| 2017 | $1,350 | $33,080 | $7,000 | $26,080 |
| 2016 | $1,351 | $33,080 | $7,000 | $26,080 |
| 2015 | $1,354 | $33,080 | $7,000 | $26,080 |
| 2014 | $1,200 | $29,680 | $3,600 | $26,080 |
Source: Public Records
Map
Nearby Homes
- 2102 Techwood Dr
- 2013 Jones Ave
- 1104 University St
- 1918 Colquitt Ave
- 1003 University St
- 802 Colquitt Cir
- 1904 Avalon Ave
- 501 Endicott Ln
- 1804 W Lincoln Ave
- 410 Endicott Ln
- 1714 W Lincoln Ave
- 1906 W Whitney Ave
- 1804 W Whitney Ave
- 2303 Joel Dr
- 400 S Shadowlawn Dr
- 1810 Edgerly Ave
- 1513 Colquitt Ave
- 1604 W Whitney Ave
- 1926 W Oglethorpe Ave
- 1700 Edgerly Ave
- 2110 Colquitt Ave
- 2101 Princeton Dr
- 2104 Colquitt Ave
- 2103 Princeton Dr
- 2112 Colquitt Ave
- 2109 Colquitt Ave
- 2105 Princeton Dr
- 2107 Colquitt Ave
- 2111 Colquitt Ave
- 1102 Auburn Dr
- 2114 Colquitt Ave
- 2105 Colquitt Ave
- 2113 Colquitt Ave
- 2107 Princeton Dr
- 2102 Colquitt Ave
- 1104 Auburn Dr
- 2115 Colquitt Ave
- 2103 Colquitt Ave
- 2109 Princeton Dr
- 2116 Colquitt Ave