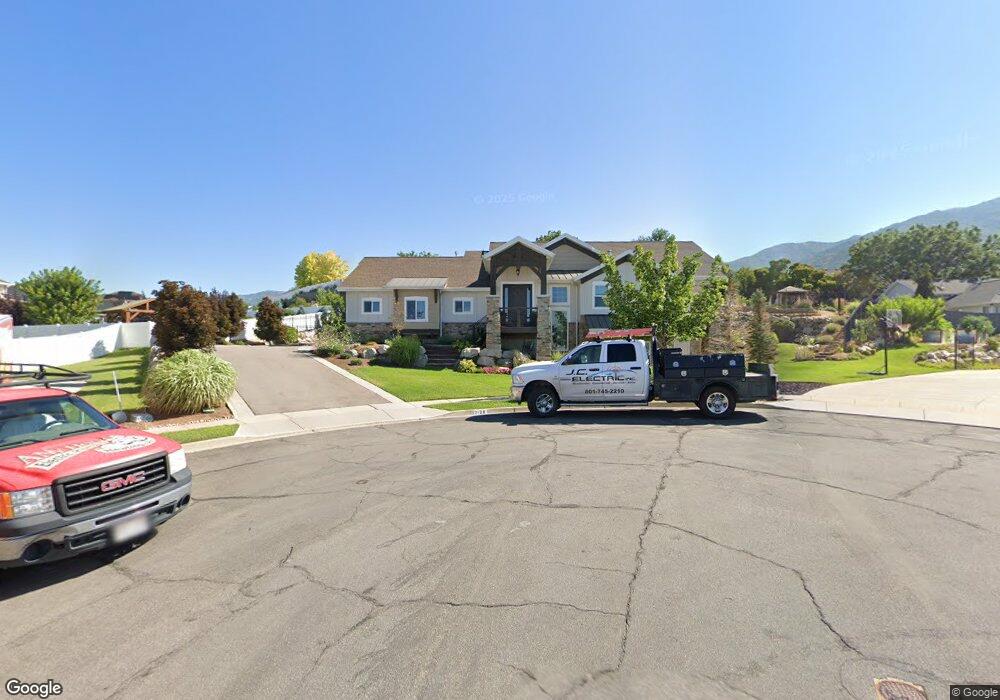
2108 E Greatblack Cir Layton, UT 84040
Estimated Value: $878,000 - $1,095,998
4
Beds
4
Baths
4,130
Sq Ft
$237/Sq Ft
Est. Value
About This Home
This home is located at 2108 E Greatblack Cir, Layton, UT 84040 and is currently estimated at $977,750, approximately $236 per square foot. 2108 E Greatblack Cir is a home located in Davis County with nearby schools including Mountain View Elementary School, North Layton Junior High School, and Northridge High School.
Ownership History
Date
Name
Owned For
Owner Type
Purchase Details
Closed on
Mar 15, 2021
Sold by
Rhodes Shayne
Bought by
Malan Douglas R and Malan Jerelyn B
Current Estimated Value
Home Financials for this Owner
Home Financials are based on the most recent Mortgage that was taken out on this home.
Original Mortgage
$287,000
Outstanding Balance
$256,823
Interest Rate
2.73%
Mortgage Type
New Conventional
Estimated Equity
$720,927
Purchase Details
Closed on
Sep 13, 2013
Sold by
Holmes Robert S and Holmes Paul D
Bought by
Rhodes Shayne
Home Financials for this Owner
Home Financials are based on the most recent Mortgage that was taken out on this home.
Original Mortgage
$417,000
Interest Rate
3.37%
Mortgage Type
Construction
Purchase Details
Closed on
Nov 3, 2009
Sold by
Gibson Robert
Bought by
Holmes Robert S and Holmes Paul D
Create a Home Valuation Report for This Property
The Home Valuation Report is an in-depth analysis detailing your home's value as well as a comparison with similar homes in the area
Home Values in the Area
Average Home Value in this Area
Purchase History
| Date | Buyer | Sale Price | Title Company |
|---|---|---|---|
| Malan Douglas R | -- | Us Title Company Of U | |
| Rhodes Shayne | -- | None Available | |
| Holmes Robert S | -- | None Available |
Source: Public Records
Mortgage History
| Date | Status | Borrower | Loan Amount |
|---|---|---|---|
| Open | Malan Douglas R | $287,000 | |
| Previous Owner | Rhodes Shayne | $417,000 |
Source: Public Records
Tax History
| Year | Tax Paid | Tax Assessment Tax Assessment Total Assessment is a certain percentage of the fair market value that is determined by local assessors to be the total taxable value of land and additions on the property. | Land | Improvement |
|---|---|---|---|---|
| 2025 | $5,623 | $546,150 | $200,236 | $345,914 |
| 2024 | $5,240 | $515,901 | $209,380 | $306,521 |
| 2023 | $5,373 | $944,000 | $214,720 | $729,280 |
| 2022 | $5,568 | $534,050 | $115,871 | $418,179 |
| 2021 | $5,048 | $720,000 | $174,737 | $545,263 |
| 2020 | $4,534 | $618,000 | $153,084 | $464,916 |
| 2019 | $4,346 | $582,000 | $149,633 | $432,367 |
| 2018 | $4,353 | $587,000 | $149,157 | $437,843 |
| 2016 | $4,072 | $289,410 | $65,920 | $223,490 |
| 2015 | $3,782 | $256,575 | $65,920 | $190,655 |
| 2014 | $1,801 | $123,140 | $59,927 | $63,213 |
| 2013 | -- | $85,557 | $85,557 | $0 |
Source: Public Records
Map
Nearby Homes
- 3232 N Redtail Way
- 1827 E Whitetail Dr
- 1821 E Whitetail Way
- 2353 Canyon View Dr
- 1935 Deere Valley Dr
- 1785 E 2825 N
- 1731 E 2825 N
- 2826 N 1600 E
- 2597 N 2300 E
- 3176 N 1450 E
- 1321 E 3125 N
- 1447 E 2700 N
- 1266 E 3125 N
- 3142 E Thorley Dr
- 2340 N 2050 E
- 1241 E 3075 N
- 3297 N Layton Ridge Dr
- 2273 N 1975 E
- 2569 N 2900 E
- 2202 N 2300 E
- 2108 E Great Black Cir Unit 14
- 2111 E Great Black Cir Unit 13
- 2094 E Greatblack Cir
- 2094 E Great Black Cir Unit 15
- 3233 N 2175 E
- 3237 N 2175 E
- 2163 E 3225 N
- 3229 N 2175 E
- 3218 N Redtail Way
- 3204 N Broadwing Dr Unit 16
- 3160 N Broadwing Dr
- 3246 N Redtail Way
- 3241 N 2175 E
- 3262 N Redtail Way
- 3181 N Broadwing Dr
- 3181 N Broadwing Dr Unit 10
- 3181 N Broadwing Dr Unit 10
- 3249 N 2175 E
- 3230 N 2175 E
- 3159 N Broadwing Dr
Your Personal Tour Guide
Ask me questions while you tour the home.