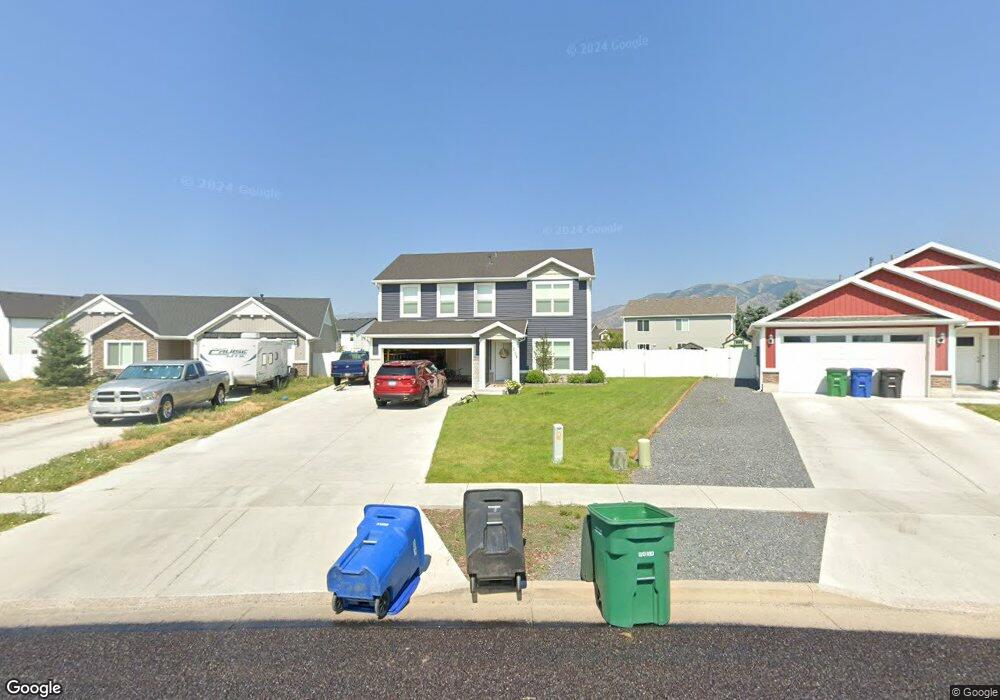
2108 S 1450 W Wellsville, UT 84339
Woodruff NeighborhoodEstimated Value: $407,000 - $551,000
3
Beds
3
Baths
1,651
Sq Ft
$278/Sq Ft
Est. Value
About This Home
This home is located at 2108 S 1450 W, Wellsville, UT 84339 and is currently estimated at $459,069, approximately $278 per square foot. 2108 S 1450 W is a home located in Cache County with nearby schools including Mountainside School, South Cache Middle School, and Mountain Crest High School.
Ownership History
Date
Name
Owned For
Owner Type
Purchase Details
Closed on
Aug 30, 2021
Sold by
Brailsford George and Brailsford Catherine
Bought by
Wilkin Eric and Wilkin Erin
Current Estimated Value
Home Financials for this Owner
Home Financials are based on the most recent Mortgage that was taken out on this home.
Original Mortgage
$376,200
Outstanding Balance
$340,288
Interest Rate
2.7%
Mortgage Type
New Conventional
Estimated Equity
$118,781
Purchase Details
Closed on
Oct 14, 2020
Sold by
Brailsford George
Bought by
Brailsford George and Brailsford Catherine
Home Financials for this Owner
Home Financials are based on the most recent Mortgage that was taken out on this home.
Original Mortgage
$196,000
Interest Rate
2.9%
Mortgage Type
New Conventional
Purchase Details
Closed on
Aug 21, 2017
Sold by
Visionary Homes Llc
Bought by
Brallsford George and Brallsford Catherine
Purchase Details
Closed on
Aug 16, 2017
Sold by
River Cove Llc
Bought by
Visionary Homes Llc
Create a Home Valuation Report for This Property
The Home Valuation Report is an in-depth analysis detailing your home's value as well as a comparison with similar homes in the area
Home Values in the Area
Average Home Value in this Area
Purchase History
| Date | Buyer | Sale Price | Title Company |
|---|---|---|---|
| Wilkin Eric | -- | Cache Title Logan | |
| Wilkin Eric | -- | Cache Title | |
| Brailsford George | -- | Pinnacle Title Ins Agcy Inc | |
| Brailsford George | -- | Pinnacle Title Ins Agcy Inc | |
| Brallsford George | -- | Cache Title Company Inc | |
| Visionary Homes Llc | -- | Cache Title Company Inc |
Source: Public Records
Mortgage History
| Date | Status | Borrower | Loan Amount |
|---|---|---|---|
| Open | Wilkin Eric | $376,200 | |
| Closed | Wilkin Eric | $376,200 | |
| Previous Owner | Brailsford George | $196,000 |
Source: Public Records
Tax History Compared to Growth
Tax History
| Year | Tax Paid | Tax Assessment Tax Assessment Total Assessment is a certain percentage of the fair market value that is determined by local assessors to be the total taxable value of land and additions on the property. | Land | Improvement |
|---|---|---|---|---|
| 2025 | $1,622 | $231,920 | $0 | $0 |
| 2024 | $1,739 | $230,730 | $0 | $0 |
| 2023 | $1,828 | $228,085 | $0 | $0 |
| 2022 | $1,919 | $228,085 | $0 | $0 |
| 2021 | $1,335 | $243,715 | $55,000 | $188,715 |
| 2020 | $1,284 | $219,100 | $55,000 | $164,100 |
| 2019 | $1,381 | $219,100 | $55,000 | $164,100 |
| 2018 | $814 | $124,000 | $30,000 | $94,000 |
| 2017 | $376 | $30,000 | $0 | $0 |
| 2016 | $384 | $30,000 | $0 | $0 |
| 2015 | $381 | $30,000 | $0 | $0 |
| 2014 | $371 | $30,000 | $0 | $0 |
Source: Public Records
Map
Nearby Homes