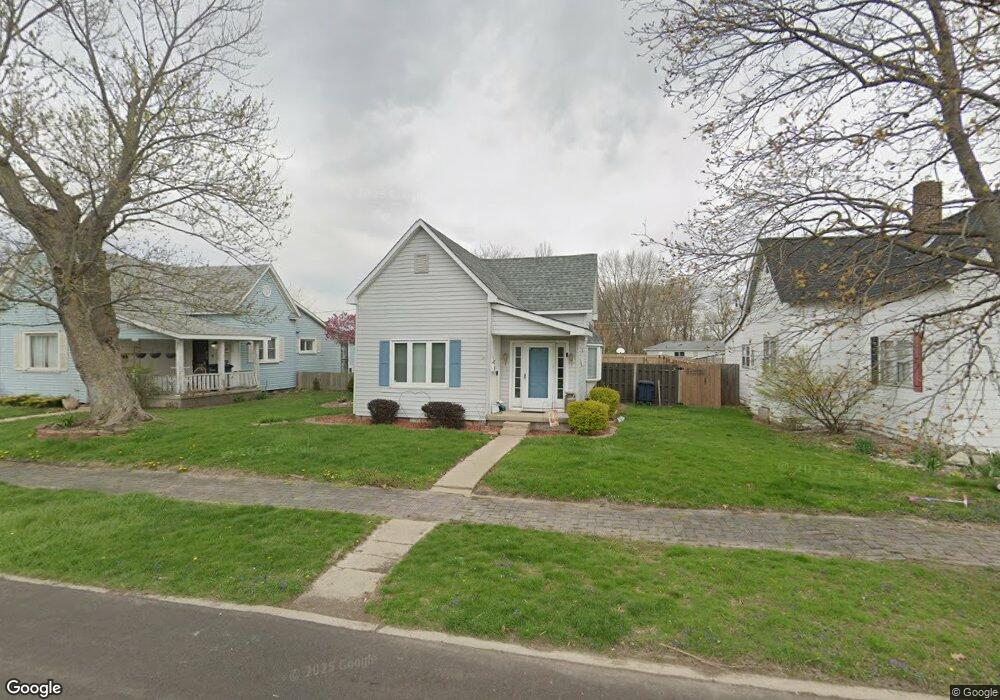
2108 S I St Elwood, IN 46036
Estimated Value: $96,000 - $172,232
4
Beds
2
Baths
1,474
Sq Ft
$85/Sq Ft
Est. Value
About This Home
This home is located at 2108 S I St, Elwood, IN 46036 and is currently estimated at $125,808, approximately $85 per square foot. 2108 S I St is a home located in Madison County with nearby schools including Elwood Elementary School, Elwood Intermediate School, and Elwood Junior-Senior High School.
Ownership History
Date
Name
Owned For
Owner Type
Purchase Details
Closed on
Dec 16, 2009
Sold by
The Huntington National Bank
Bought by
Fulton Daniel L
Current Estimated Value
Purchase Details
Closed on
Sep 18, 2009
Sold by
Richards Stephen Kyle
Bought by
The Huntington National Bank
Purchase Details
Closed on
May 21, 2007
Sold by
Sherman Terry and Sherman Sue Ellen
Bought by
Richards Stephen Kyle
Home Financials for this Owner
Home Financials are based on the most recent Mortgage that was taken out on this home.
Original Mortgage
$83,500
Interest Rate
6.21%
Mortgage Type
New Conventional
Create a Home Valuation Report for This Property
The Home Valuation Report is an in-depth analysis detailing your home's value as well as a comparison with similar homes in the area
Home Values in the Area
Average Home Value in this Area
Purchase History
| Date | Buyer | Sale Price | Title Company |
|---|---|---|---|
| Fulton Daniel L | -- | -- | |
| The Huntington National Bank | $24,712 | -- | |
| Richards Stephen Kyle | -- | -- |
Source: Public Records
Mortgage History
| Date | Status | Borrower | Loan Amount |
|---|---|---|---|
| Previous Owner | Richards Stephen Kyle | $83,500 |
Source: Public Records
Tax History Compared to Growth
Tax History
| Year | Tax Paid | Tax Assessment Tax Assessment Total Assessment is a certain percentage of the fair market value that is determined by local assessors to be the total taxable value of land and additions on the property. | Land | Improvement |
|---|---|---|---|---|
| 2024 | -- | $100,300 | $10,400 | $89,900 |
| 2023 | -- | $91,400 | $9,900 | $81,500 |
| 2022 | $10 | $90,900 | $9,400 | $81,500 |
| 2021 | $0 | $82,500 | $7,300 | $75,200 |
| 2020 | $0 | $86,700 | $7,000 | $79,700 |
| 2019 | $10 | $77,000 | $7,000 | $70,000 |
| 2018 | $10 | $72,400 | $7,000 | $65,400 |
| 2017 | $0 | $77,800 | $7,000 | $70,800 |
| 2016 | $10 | $87,700 | $7,900 | $79,800 |
| 2014 | -- | $86,800 | $7,900 | $78,900 |
| 2013 | -- | $88,000 | $7,900 | $80,100 |
Source: Public Records
Map
Nearby Homes