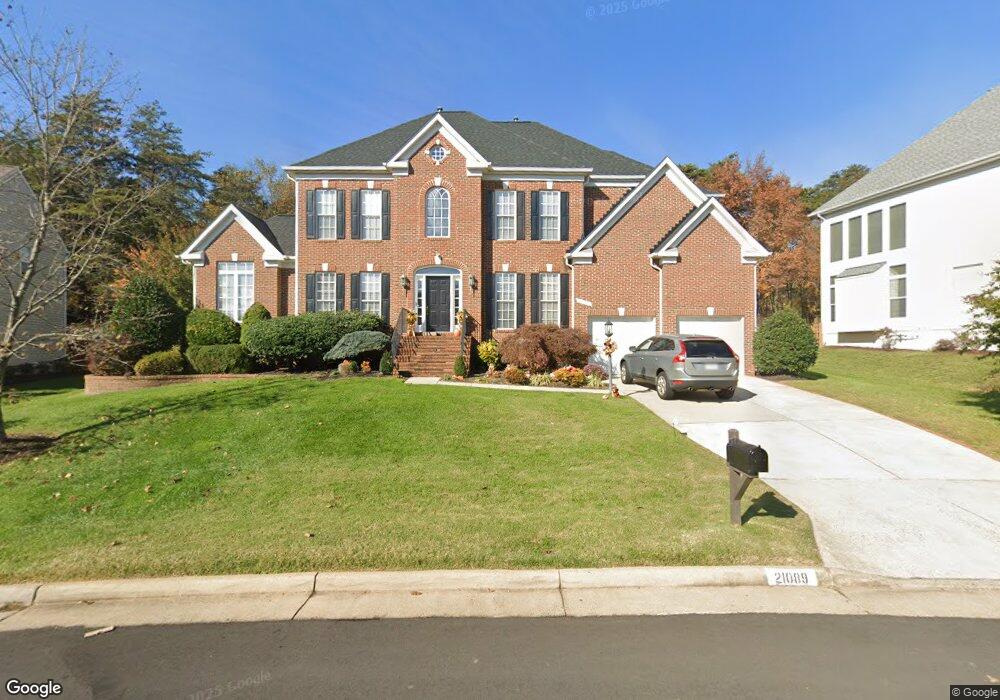
21089 Carthagena Ct Ashburn, VA 20147
Estimated Value: $962,116 - $1,138,000
4
Beds
5
Baths
3,028
Sq Ft
$354/Sq Ft
Est. Value
About This Home
This home is located at 21089 Carthagena Ct, Ashburn, VA 20147 and is currently estimated at $1,073,279, approximately $354 per square foot. 21089 Carthagena Ct is a home located in Loudoun County with nearby schools including Dominion Trail Elementary School, Farmwell Station Middle School, and Broad Run High School.
Ownership History
Date
Name
Owned For
Owner Type
Purchase Details
Closed on
Oct 12, 2004
Sold by
Gmac Global Relocation
Bought by
Gray Gresford
Current Estimated Value
Home Financials for this Owner
Home Financials are based on the most recent Mortgage that was taken out on this home.
Original Mortgage
$578,400
Interest Rate
5.69%
Mortgage Type
New Conventional
Purchase Details
Closed on
Aug 28, 2004
Sold by
Sportelli Mrk L
Bought by
Gmac Global Relocarion Service
Home Financials for this Owner
Home Financials are based on the most recent Mortgage that was taken out on this home.
Original Mortgage
$578,400
Interest Rate
5.69%
Mortgage Type
New Conventional
Purchase Details
Closed on
Apr 8, 1999
Sold by
Sunline Inc
Bought by
Sportelli Mark L
Home Financials for this Owner
Home Financials are based on the most recent Mortgage that was taken out on this home.
Original Mortgage
$240,000
Interest Rate
6.83%
Create a Home Valuation Report for This Property
The Home Valuation Report is an in-depth analysis detailing your home's value as well as a comparison with similar homes in the area
Home Values in the Area
Average Home Value in this Area
Purchase History
| Date | Buyer | Sale Price | Title Company |
|---|---|---|---|
| Gray Gresford | $723,000 | -- | |
| Gmac Global Relocarion Service | $723,000 | -- | |
| Sportelli Mark L | $320,660 | -- |
Source: Public Records
Mortgage History
| Date | Status | Borrower | Loan Amount |
|---|---|---|---|
| Previous Owner | Gray Gresford | $578,400 | |
| Previous Owner | Sportelli Mark L | $240,000 |
Source: Public Records
Tax History Compared to Growth
Tax History
| Year | Tax Paid | Tax Assessment Tax Assessment Total Assessment is a certain percentage of the fair market value that is determined by local assessors to be the total taxable value of land and additions on the property. | Land | Improvement |
|---|---|---|---|---|
| 2025 | $7,597 | $943,680 | $300,100 | $643,580 |
| 2024 | $7,628 | $881,880 | $295,100 | $586,780 |
| 2023 | $7,283 | $832,300 | $295,100 | $537,200 |
| 2022 | $7,010 | $787,690 | $270,100 | $517,590 |
| 2021 | $6,777 | $691,510 | $220,100 | $471,410 |
| 2020 | $6,774 | $654,450 | $200,300 | $454,150 |
| 2019 | $6,708 | $641,870 | $200,300 | $441,570 |
| 2018 | $6,351 | $585,380 | $180,300 | $405,080 |
| 2017 | $6,427 | $571,250 | $180,300 | $390,950 |
| 2016 | $6,595 | $575,960 | $0 | $0 |
| 2015 | $6,861 | $424,210 | $0 | $424,210 |
| 2014 | $6,792 | $407,790 | $0 | $407,790 |
Source: Public Records
Map
Nearby Homes
- 21085 Carthagena Ct
- 43866 Laburnum Square
- 43800 Stonebridge Dr
- 43876 Laburnum Square
- 21250 Dubois Ct
- 43949 Bruceton Mills Cir
- 43793 Steinbeck Square
- 43877 Sandburg Square
- 21376 Clappertown Dr
- 21312 Lord Nelson Terrace
- 44135 Tippecanoe Terrace
- 43564 Golden Meadow Cir
- 20857 Ashburn Rd
- 43834 Jenkins Ln
- 43507 Blacksmith Square
- 44231 Litchfield Terrace
- 43485 Plantation Terrace
- 44248 Suscon Square
- 43494 Postrail Square
- 43501 Postrail Square
- 21093 Carthagena Ct
- 21092 Carthagena Ct
- 21081 Carthagena Ct
- 21088 Carthagena Ct
- 21097 Carthagena Ct
- 21084 Carthagena Ct
- 43840 Laburnum Square
- 21073 Carthagena Ct
- 21151 Crocus Terrace
- 43842 Laburnum Square
- 21080 Carthagena Ct
- 21101 Carthagena Ct
- 43836 Laburnum Square
- 43844 Laburnum Square
- 43834 Laburnum Square
- 21149 Crocus Terrace
- 43832 Laburnum Square
- 43846 Laburnum Square
- 43830 Laburnum Square
- 21147 Crocus Terrace