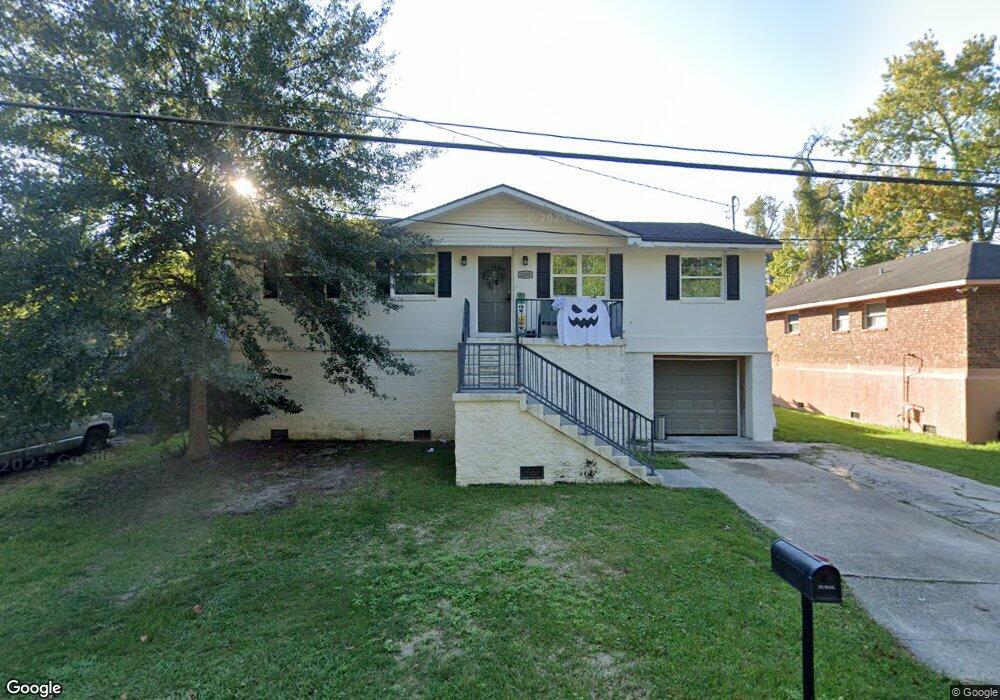
2109 11th St Slidell, LA 70458
Estimated Value: $159,000 - $201,000
3
Beds
2
Baths
1,385
Sq Ft
$127/Sq Ft
Est. Value
About This Home
This home is located at 2109 11th St, Slidell, LA 70458 and is currently estimated at $176,013, approximately $127 per square foot. 2109 11th St is a home located in St. Tammany Parish with nearby schools including Glynn H. Brock Elementary School, St. Tammany Junior High School, and Salmen High School.
Ownership History
Date
Name
Owned For
Owner Type
Purchase Details
Closed on
Nov 7, 2019
Sold by
Gomez James R and Gomez Janie P
Bought by
Gomez Dominick J
Current Estimated Value
Home Financials for this Owner
Home Financials are based on the most recent Mortgage that was taken out on this home.
Original Mortgage
$147,474
Outstanding Balance
$129,739
Interest Rate
3.6%
Mortgage Type
New Conventional
Estimated Equity
$46,274
Purchase Details
Closed on
Jul 1, 2014
Sold by
Gomez Danell H
Bought by
Gomez James R and Gomez Janie P
Create a Home Valuation Report for This Property
The Home Valuation Report is an in-depth analysis detailing your home's value as well as a comparison with similar homes in the area
Home Values in the Area
Average Home Value in this Area
Purchase History
| Date | Buyer | Sale Price | Title Company |
|---|---|---|---|
| Gomez Dominick J | $146,000 | Bayou Title | |
| Gomez James R | $13,264 | -- |
Source: Public Records
Mortgage History
| Date | Status | Borrower | Loan Amount |
|---|---|---|---|
| Open | Gomez Dominick J | $147,474 |
Source: Public Records
Tax History Compared to Growth
Tax History
| Year | Tax Paid | Tax Assessment Tax Assessment Total Assessment is a certain percentage of the fair market value that is determined by local assessors to be the total taxable value of land and additions on the property. | Land | Improvement |
|---|---|---|---|---|
| 2024 | $1,530 | $10,310 | $600 | $9,710 |
| 2023 | $1,631 | $8,279 | $600 | $7,679 |
| 2022 | $141,669 | $8,279 | $600 | $7,679 |
| 2021 | $1,416 | $8,279 | $600 | $7,679 |
| 2020 | $1,410 | $8,279 | $600 | $7,679 |
| 2019 | $1,505 | $8,536 | $1,400 | $7,136 |
| 2018 | $1,509 | $8,536 | $1,400 | $7,136 |
| 2017 | $1,519 | $8,536 | $1,400 | $7,136 |
| 2016 | $1,553 | $8,536 | $1,400 | $7,136 |
| 2015 | $1,547 | $8,536 | $1,400 | $7,136 |
| 2014 | -- | $8,536 | $1,400 | $7,136 |
| 2013 | -- | $8,536 | $1,400 | $7,136 |
Source: Public Records
Map
Nearby Homes