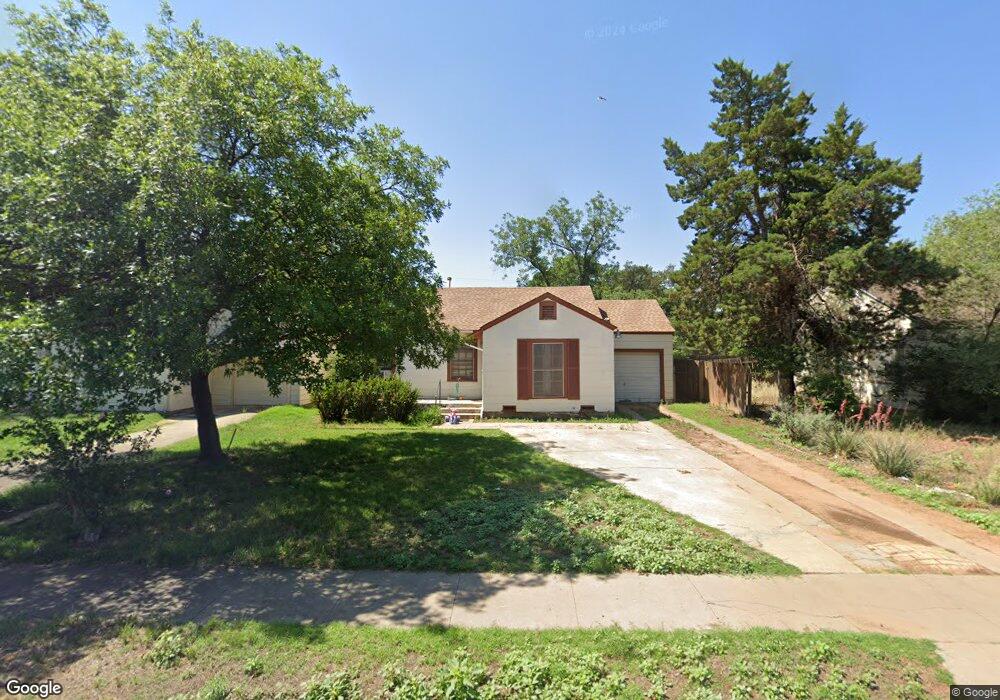
2109 31st St Lubbock, TX 79411
Heart of Lubbock NeighborhoodEstimated Value: $115,000 - $119,000
2
Beds
1
Bath
1,020
Sq Ft
$115/Sq Ft
Est. Value
About This Home
This home is located at 2109 31st St, Lubbock, TX 79411 and is currently estimated at $117,382, approximately $115 per square foot. 2109 31st St is a home located in Lubbock County with nearby schools including Dupre Elementary School, Brown Elementary School, and Slaton Middle School.
Ownership History
Date
Name
Owned For
Owner Type
Purchase Details
Closed on
Jul 15, 2022
Sold by
Terry Browder
Bought by
Da And S Enterprises Llc
Current Estimated Value
Home Financials for this Owner
Home Financials are based on the most recent Mortgage that was taken out on this home.
Original Mortgage
$72,100
Outstanding Balance
$68,481
Interest Rate
5.23%
Mortgage Type
New Conventional
Estimated Equity
$48,901
Purchase Details
Closed on
Aug 31, 1993
Sold by
Mcmurry Mintah Harris
Bought by
Carson Colleen
Purchase Details
Closed on
Mar 1, 1982
Bought by
Carson Colleen
Create a Home Valuation Report for This Property
The Home Valuation Report is an in-depth analysis detailing your home's value as well as a comparison with similar homes in the area
Home Values in the Area
Average Home Value in this Area
Purchase History
| Date | Buyer | Sale Price | Title Company |
|---|---|---|---|
| Da And S Enterprises Llc | $59,600 | None Listed On Document | |
| Carson Colleen | -- | -- | |
| Carson Colleen | -- | -- |
Source: Public Records
Mortgage History
| Date | Status | Borrower | Loan Amount |
|---|---|---|---|
| Open | Da And S Enterprises Llc | $72,100 |
Source: Public Records
Tax History Compared to Growth
Tax History
| Year | Tax Paid | Tax Assessment Tax Assessment Total Assessment is a certain percentage of the fair market value that is determined by local assessors to be the total taxable value of land and additions on the property. | Land | Improvement |
|---|---|---|---|---|
| 2025 | $2,197 | $107,158 | $25,000 | $82,158 |
| 2024 | $2,197 | $124,191 | $25,000 | $99,191 |
| 2023 | $1,874 | $100,818 | $13,650 | $87,168 |
| 2022 | $1,602 | $79,138 | $13,650 | $80,655 |
| 2021 | $1,541 | $71,944 | $13,650 | $58,294 |
| 2020 | $1,525 | $70,121 | $13,650 | $56,471 |
| 2019 | $1,431 | $63,746 | $13,650 | $50,096 |
| 2018 | $1,419 | $63,141 | $13,650 | $49,491 |
| 2017 | $1,292 | $57,401 | $2,750 | $54,651 |
| 2016 | $1,230 | $54,668 | $2,750 | $51,918 |
| 2015 | $164 | $53,660 | $2,750 | $50,910 |
| 2014 | $164 | $50,771 | $2,750 | $48,021 |
Source: Public Records
Map
Nearby Homes