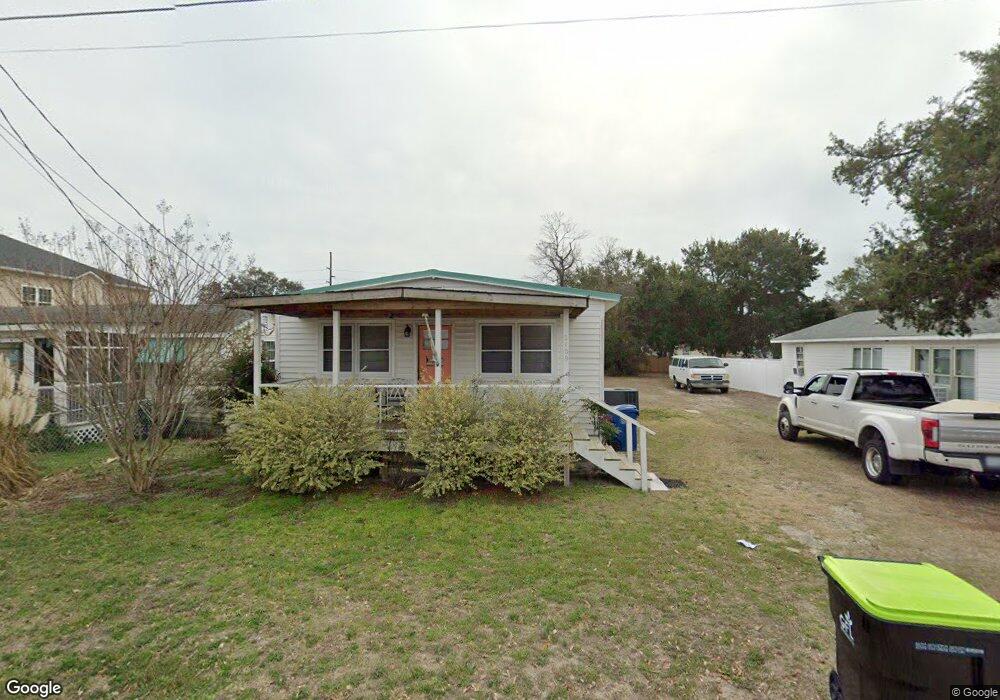
2109 Bay St Morehead City, NC 28557
Estimated Value: $223,000 - $246,000
2
Beds
1
Bath
864
Sq Ft
$273/Sq Ft
Est. Value
About This Home
This home is located at 2109 Bay St, Morehead City, NC 28557 and is currently estimated at $235,745, approximately $272 per square foot. 2109 Bay St is a home located in Carteret County with nearby schools including Morehead City Primary School, Morehead Elementary School at Camp Glenn, and Morehead City Middle School.
Ownership History
Date
Name
Owned For
Owner Type
Purchase Details
Closed on
Jan 6, 2021
Sold by
2111 Bay St Llc
Bought by
Harris John F
Current Estimated Value
Purchase Details
Closed on
Jul 10, 2017
Sold by
Dickinson Ladon P and Dickinson Rachel
Bought by
211 Bays St L L C
Home Financials for this Owner
Home Financials are based on the most recent Mortgage that was taken out on this home.
Original Mortgage
$67,500
Interest Rate
3.95%
Mortgage Type
Purchase Money Mortgage
Purchase Details
Closed on
May 17, 2017
Sold by
Dickinson Ladon P and Bonnie Lee Patti Irrevocable T
Bought by
Dickson Ladon P
Home Financials for this Owner
Home Financials are based on the most recent Mortgage that was taken out on this home.
Original Mortgage
$67,500
Interest Rate
3.95%
Mortgage Type
Purchase Money Mortgage
Purchase Details
Closed on
Jul 16, 2013
Sold by
Patti Bonnie Lee
Bought by
Patti Bonnie Lee
Create a Home Valuation Report for This Property
The Home Valuation Report is an in-depth analysis detailing your home's value as well as a comparison with similar homes in the area
Home Values in the Area
Average Home Value in this Area
Purchase History
| Date | Buyer | Sale Price | Title Company |
|---|---|---|---|
| Harris John F | $122,500 | None Available | |
| Harris John F | $122,500 | None Listed On Document | |
| 211 Bays St L L C | $67,500 | None Available | |
| Dickson Ladon P | -- | None Available | |
| Patti Bonnie Lee | -- | None Available | |
| Dickinson Ladon P | -- | None Available |
Source: Public Records
Mortgage History
| Date | Status | Borrower | Loan Amount |
|---|---|---|---|
| Previous Owner | 211 Bays St L L C | $67,500 |
Source: Public Records
Tax History Compared to Growth
Tax History
| Year | Tax Paid | Tax Assessment Tax Assessment Total Assessment is a certain percentage of the fair market value that is determined by local assessors to be the total taxable value of land and additions on the property. | Land | Improvement |
|---|---|---|---|---|
| 2025 | $1,352 | $220,918 | $78,500 | $142,418 |
| 2024 | $763 | $88,678 | $50,625 | $38,053 |
| 2023 | $308 | $88,678 | $50,625 | $38,053 |
| 2022 | $308 | $88,678 | $50,625 | $38,053 |
| 2021 | $308 | $88,678 | $50,625 | $38,053 |
| 2020 | $302 | $86,941 | $50,625 | $36,316 |
| 2019 | $249 | $75,527 | $34,875 | $40,652 |
| 2017 | $249 | $75,527 | $34,875 | $40,652 |
| 2016 | $249 | $75,527 | $34,875 | $40,652 |
| 2015 | $242 | $75,527 | $34,875 | $40,652 |
| 2014 | -- | $99,371 | $64,140 | $35,231 |
Source: Public Records
Map
Nearby Homes