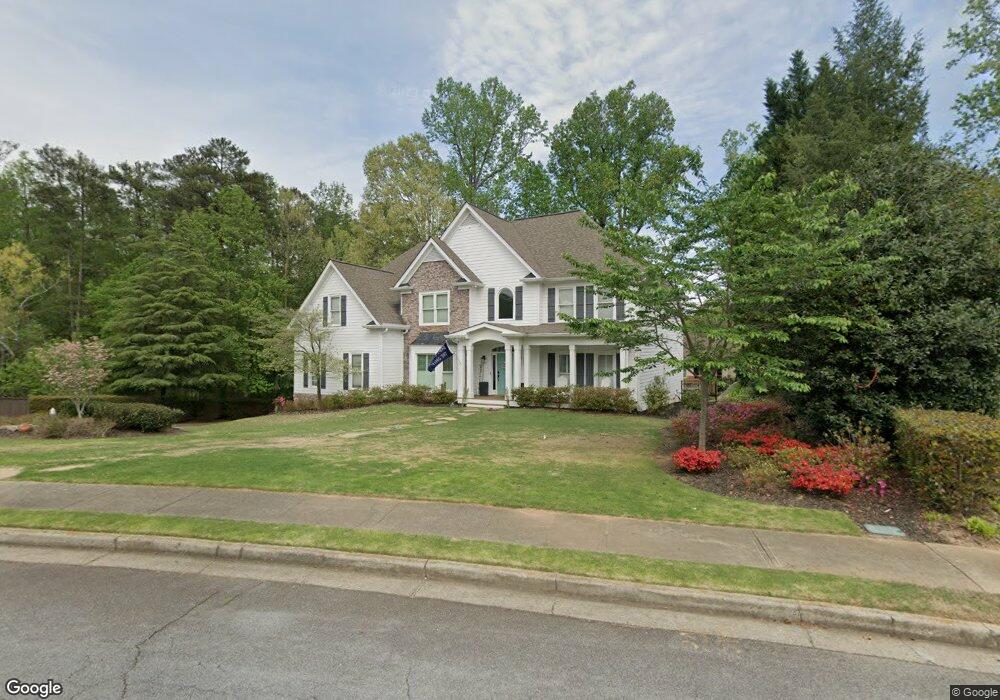
2109 Bogan Lake Dunwoody, GA 30338
Estimated Value: $1,006,000 - $1,234,000
5
Beds
5
Baths
4,003
Sq Ft
$274/Sq Ft
Est. Value
About This Home
This home is located at 2109 Bogan Lake, Dunwoody, GA 30338 and is currently estimated at $1,095,955, approximately $273 per square foot. 2109 Bogan Lake is a home located in DeKalb County with nearby schools including Kingsley Elementary School, Peachtree Middle School, and Dunwoody High School.
Ownership History
Date
Name
Owned For
Owner Type
Purchase Details
Closed on
Aug 23, 2018
Sold by
Kol Avner
Bought by
Wicklund John V
Current Estimated Value
Home Financials for this Owner
Home Financials are based on the most recent Mortgage that was taken out on this home.
Original Mortgage
$514,856
Outstanding Balance
$447,132
Interest Rate
4.5%
Estimated Equity
$648,823
Purchase Details
Closed on
Jan 28, 2005
Sold by
Kol Avner
Bought by
Kol Avner and Kol Anat
Home Financials for this Owner
Home Financials are based on the most recent Mortgage that was taken out on this home.
Original Mortgage
$508,000
Interest Rate
5.25%
Mortgage Type
New Conventional
Purchase Details
Closed on
Aug 28, 2001
Sold by
Hall Francis L
Bought by
Hall Rachel J
Purchase Details
Closed on
Sep 9, 1996
Sold by
San Dall Housing Group
Bought by
Hall Francis L Rache
Create a Home Valuation Report for This Property
The Home Valuation Report is an in-depth analysis detailing your home's value as well as a comparison with similar homes in the area
Home Values in the Area
Average Home Value in this Area
Purchase History
| Date | Buyer | Sale Price | Title Company |
|---|---|---|---|
| Wicklund John V | $565,000 | -- | |
| Kol Avner | -- | -- | |
| Kol Avner | $635,000 | -- | |
| Hall Rachel J | -- | -- | |
| Hall Francis L Rache | $437,800 | -- |
Source: Public Records
Mortgage History
| Date | Status | Borrower | Loan Amount |
|---|---|---|---|
| Open | Wicklund John V | $514,856 | |
| Previous Owner | Kol Avner | $508,000 | |
| Closed | Hall Francis L Rache | $0 |
Source: Public Records
Tax History Compared to Growth
Tax History
| Year | Tax Paid | Tax Assessment Tax Assessment Total Assessment is a certain percentage of the fair market value that is determined by local assessors to be the total taxable value of land and additions on the property. | Land | Improvement |
|---|---|---|---|---|
| 2025 | $10,015 | $372,680 | $82,400 | $290,280 |
| 2024 | $10,823 | $400,680 | $82,400 | $318,280 |
| 2023 | $10,823 | $373,760 | $82,400 | $291,360 |
| 2022 | $9,156 | $325,840 | $82,400 | $243,440 |
| 2021 | $7,999 | $280,960 | $82,400 | $198,560 |
| 2020 | $7,191 | $241,480 | $82,400 | $159,080 |
| 2019 | $6,599 | $226,000 | $65,720 | $160,280 |
| 2018 | $10,471 | $255,960 | $88,480 | $167,480 |
| 2017 | $10,465 | $253,760 | $88,480 | $165,280 |
| 2016 | $9,638 | $236,720 | $88,480 | $148,240 |
| 2014 | $9,572 | $225,080 | $88,720 | $136,360 |
Source: Public Records
Map
Nearby Homes
- 5231 Seaton Dr
- 5401 Seaton Way
- 5145 Davantry Dr
- 5212 Falkirk Dr
- 5015 Oakhurst Walk
- 1971 Wellesley Trace
- 1983 Wellesley Trace
- 5513 N Peachtree Rd
- 2220 Spring Mill Cove
- 5318 Brooke Farm Dr
- 5004 Delverton Ct Unit 8
- 2293 Littlebrooke Trace
- 4942 Lakeland Woods Ct
- 1933 Rotherham Way
- 5284 Brookelake Dr
- 5417 Trentham Dr
- 5427 Trentham Dr
- 2109 Bogans Lake Path
- 5129 Sheridan Ln
- 2098 Bogans Lake Path Unit 1
- 5134 Sheridan Ln Unit 1
- 2127 Bogans Lake Path Unit 3
- 5118 Sheridan Ln Unit 1
- 5119 Sheridan Ln Unit 1
- 5150 Sheridan Ln
- 5153 Sheridan Ln
- 0 Sheridan Ln
- 2077 Renfroe Lake Dr Unit 1
- 5113 Sheridan Ln Unit 1
- 0 Renfroe Lake Dr Unit 7630789
- 0 Renfroe Lake Dr
- 0 Bogans Lake Path
- 5112 Sheridan Ln
- 2132 Bogans Lake Path Unit 3
- 5161 Sheridan Ln Unit 1
- 5109 Sheridan Ln
- 5170 Goodchild Ct