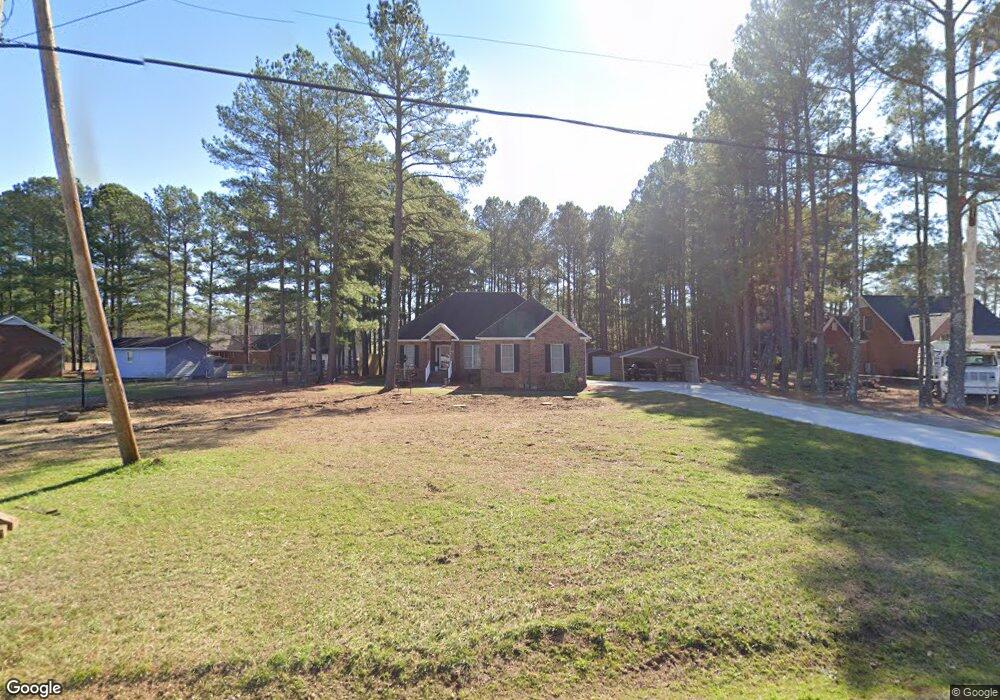
2109 Carthage St Sanford, NC 27330
Estimated Value: $279,000 - $318,000
3
Beds
2
Baths
1,656
Sq Ft
$182/Sq Ft
Est. Value
About This Home
This home is located at 2109 Carthage St, Sanford, NC 27330 and is currently estimated at $301,279, approximately $181 per square foot. 2109 Carthage St is a home with nearby schools including J.R. Ingram Jr. Elementary School, Sanlee Middle School, and Southern Lee High School.
Ownership History
Date
Name
Owned For
Owner Type
Purchase Details
Closed on
Feb 12, 2021
Sold by
Britt Monte Q
Bought by
Bridges John Wesley
Current Estimated Value
Purchase Details
Closed on
Aug 15, 2014
Sold by
Britt Susan P
Bought by
Britt Monte Q
Home Financials for this Owner
Home Financials are based on the most recent Mortgage that was taken out on this home.
Original Mortgage
$148,500
Interest Rate
3.75%
Mortgage Type
Adjustable Rate Mortgage/ARM
Create a Home Valuation Report for This Property
The Home Valuation Report is an in-depth analysis detailing your home's value as well as a comparison with similar homes in the area
Home Values in the Area
Average Home Value in this Area
Purchase History
| Date | Buyer | Sale Price | Title Company |
|---|---|---|---|
| Bridges John Wesley | $170,000 | None Available | |
| Bridges John Wesley | $170,000 | None Listed On Document | |
| Britt Monte Q | -- | None Available |
Source: Public Records
Mortgage History
| Date | Status | Borrower | Loan Amount |
|---|---|---|---|
| Previous Owner | Britt Monte Q | $148,500 |
Source: Public Records
Tax History Compared to Growth
Tax History
| Year | Tax Paid | Tax Assessment Tax Assessment Total Assessment is a certain percentage of the fair market value that is determined by local assessors to be the total taxable value of land and additions on the property. | Land | Improvement |
|---|---|---|---|---|
| 2025 | -- | $242,600 | $22,500 | $220,100 |
| 2024 | $1,025 | $242,600 | $22,500 | $220,100 |
| 2023 | $1,025 | $242,600 | $22,500 | $220,100 |
| 2022 | $860 | $173,600 | $18,000 | $155,600 |
| 2021 | $1,617 | $173,600 | $18,000 | $155,600 |
| 2020 | $1,620 | $173,600 | $18,000 | $155,600 |
| 2019 | $1,620 | $173,600 | $18,000 | $155,600 |
| 2018 | $1,643 | $172,300 | $18,000 | $154,300 |
| 2017 | $1,632 | $172,300 | $18,000 | $154,300 |
| 2016 | $1,618 | $172,300 | $18,000 | $154,300 |
| 2014 | $1,484 | $172,300 | $18,000 | $154,300 |
Source: Public Records
Map
Nearby Homes
- 737 Richardson Dr
- 729 Richardson Dr
- 5216 Tyndall Dr
- 5220 Tyndall Dr
- 5212 Tyndall Dr
- 5224 Tyndall Dr
- 5228 Tyndall Dr
- 5232 Tyndall Dr
- 5208 Tyndall Dr
- 5058 Tyndall Dr
- 5054 Tyndall Dr
- Freelance Plan at Brantley Place
- Intrigue Plan at Brantley Place
- Prelude Plan at Brantley Place
- Vantage Plan at Brantley Place
- 343 Scottsdale Dr
- 5204 Tyndall Dr
- 5200 Tyndall Dr
- 733 Richardson Dr
- 5132 Tyndall Dr
- 2113 Carthage St
- 5215 Tyndall Dr
- 2103 Carthage St
- 5211 Tyndall Dr
- 5207 Tyndall Dr
- 2119 Carthage St
- 2112 Carthage St
- 1706 Butler St
- 0 Pioneer Dr
- 2118 Carthage St
- 5203 Tyndall Dr
- 2123 Carthage St
- 2100 Carthage St
- 1800 Butler St
- 2122 Carthage St
- 2110 Carthage St
- 2127 Carthage St
- 2014 Carthage St
- 5115 Tyndall Dr
- 1804 Butler St