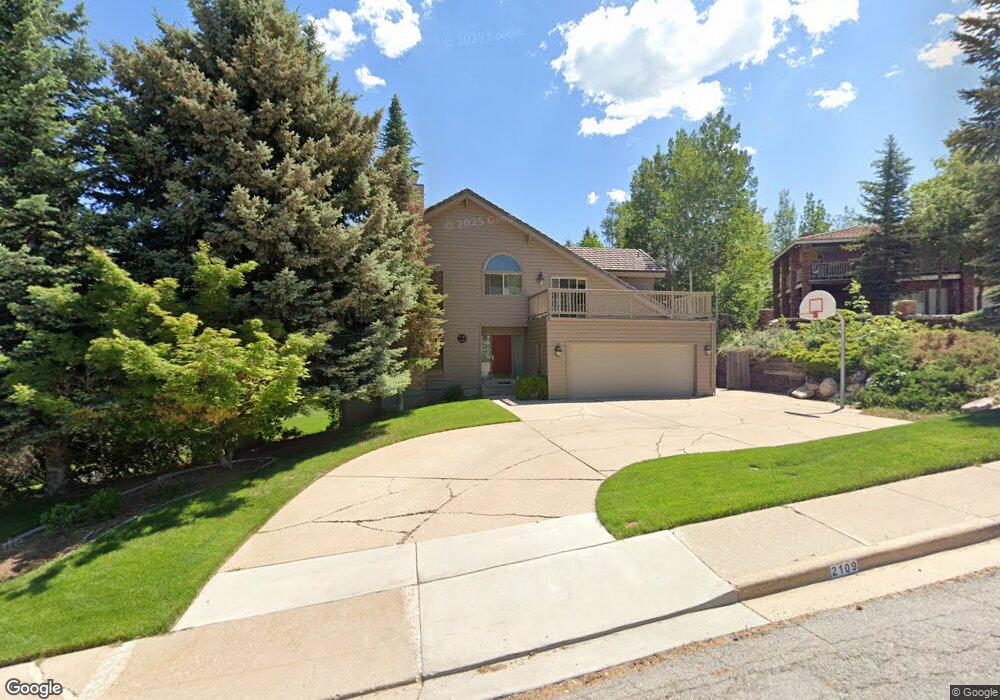
2109 Cave Hollow Way Bountiful, UT 84010
Estimated Value: $565,000 - $754,103
2
Beds
2
Baths
2,158
Sq Ft
$308/Sq Ft
Est. Value
About This Home
This home is located at 2109 Cave Hollow Way, Bountiful, UT 84010 and is currently estimated at $664,026, approximately $307 per square foot. 2109 Cave Hollow Way is a home located in Davis County with nearby schools including Valley View School, Mueller Park Junior High School, and Bountiful High School.
Create a Home Valuation Report for This Property
The Home Valuation Report is an in-depth analysis detailing your home's value as well as a comparison with similar homes in the area
Home Values in the Area
Average Home Value in this Area
Tax History Compared to Growth
Tax History
| Year | Tax Paid | Tax Assessment Tax Assessment Total Assessment is a certain percentage of the fair market value that is determined by local assessors to be the total taxable value of land and additions on the property. | Land | Improvement |
|---|---|---|---|---|
| 2025 | $3,651 | $363,550 | $223,502 | $140,048 |
| 2024 | $3,386 | $342,651 | $282,024 | $60,627 |
| 2023 | $3,376 | $618,000 | $332,025 | $285,975 |
| 2022 | $3,395 | $340,450 | $178,300 | $162,150 |
| 2021 | $3,155 | $485,000 | $262,019 | $222,981 |
| 2020 | $2,701 | $420,000 | $243,353 | $176,647 |
| 2019 | $2,673 | $406,000 | $251,332 | $154,668 |
| 2018 | $2,490 | $374,000 | $253,212 | $120,788 |
| 2016 | $2,105 | $171,435 | $76,508 | $94,927 |
| 2015 | $2,115 | $162,910 | $76,508 | $86,402 |
| 2014 | $1,932 | $152,277 | $76,508 | $75,769 |
| 2013 | -- | $147,327 | $106,346 | $40,981 |
Source: Public Records
Map
Nearby Homes
- 1960 S High Pointe Dr Unit 22
- 1820 S High Pointe Dr
- 2063 Ridgehollow Dr
- 1483 Maple Hills Dr
- 2679 Wood Hollow Way
- 2845 Wood Hollow Way
- 1735 S Temple Ct Unit 203
- 1785 1450 E Unit 604
- 1596 E Millbrook Way
- 1399 E Millbrook Way
- 2321 S 900 E
- 831 E San Simeon Way S
- 771 E 1825 S
- 1761 S Davis Blvd
- 630 E 1800 S
- 957 Chelsea Dr
- 2024 Bonneview Dr
- 2177 Bonneview Dr
- 861 E Millbrook Way
- 540 N 1300 E Unit 10
- 2089 Cave Hollow Way
- 2127 Wood Hollow Way
- 1979 Cave Hollow Way
- 1979 Cave Hollow Way Unit 29
- 1696 Mueller Park Rd
- 2126 Cave Hollow Way
- 2096 Cave Hollow Way
- 2180 Wood Hollow Way
- 1969 Cave Hollow Way
- 1712 Mueller Park Rd
- 2060 Cave Hollow Way
- 2186 Cave Hollow Way
- 1959 High Pointe Dr
- 2175 Wood Hollow Way
- 1686 Mueller Park Rd
- 1947 High Pointe Dr Unit 27
- 1947 High Pointe Dr
- 1726 Mueller Park Rd
- 2223 Cave Hollow Way
- 2140 Cave Hollow Way