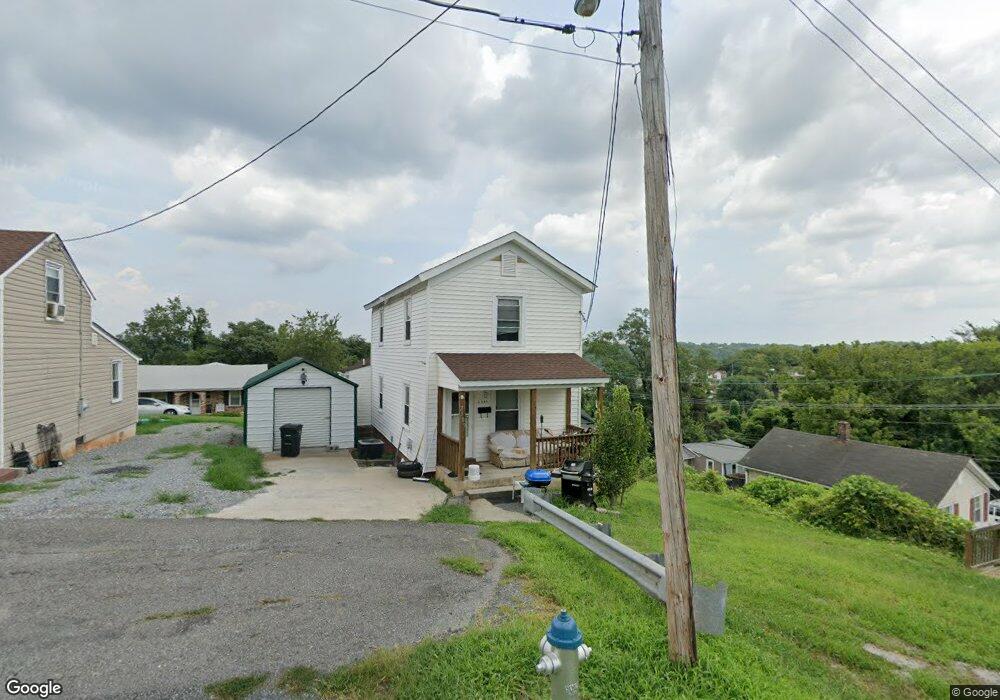
2109 Cedar St Lynchburg, VA 24504
White Rock Hill NeighborhoodEstimated Value: $80,000 - $133,000
--
Bed
1
Bath
1,316
Sq Ft
$75/Sq Ft
Est. Value
About This Home
This home is located at 2109 Cedar St, Lynchburg, VA 24504 and is currently estimated at $99,287, approximately $75 per square foot. 2109 Cedar St is a home located in Lynchburg City with nearby schools including Sandusky Elementary School, Sandusky Middle School, and Heritage High School.
Ownership History
Date
Name
Owned For
Owner Type
Purchase Details
Closed on
Aug 5, 2019
Sold by
Richerson Angela
Bought by
Shabazz Malik
Current Estimated Value
Purchase Details
Closed on
Jun 25, 2018
Sold by
Randolph Cleven E
Bought by
Shabazz Malik and Richerson Angela E
Home Financials for this Owner
Home Financials are based on the most recent Mortgage that was taken out on this home.
Original Mortgage
$43,498
Interest Rate
4.6%
Mortgage Type
FHA
Create a Home Valuation Report for This Property
The Home Valuation Report is an in-depth analysis detailing your home's value as well as a comparison with similar homes in the area
Home Values in the Area
Average Home Value in this Area
Purchase History
| Date | Buyer | Sale Price | Title Company |
|---|---|---|---|
| Shabazz Malik | -- | None Available | |
| Shabazz Malik | $45,000 | Advantage Title & Closing Ll |
Source: Public Records
Mortgage History
| Date | Status | Borrower | Loan Amount |
|---|---|---|---|
| Previous Owner | Shabazz Malik | $43,498 |
Source: Public Records
Tax History Compared to Growth
Tax History
| Year | Tax Paid | Tax Assessment Tax Assessment Total Assessment is a certain percentage of the fair market value that is determined by local assessors to be the total taxable value of land and additions on the property. | Land | Improvement |
|---|---|---|---|---|
| 2025 | $1,028 | $122,400 | $12,000 | $110,400 |
| 2024 | $556 | $62,500 | $7,500 | $55,000 |
| 2023 | $556 | $62,500 | $7,500 | $55,000 |
| 2022 | $593 | $57,600 | $5,000 | $52,600 |
| 2021 | $639 | $57,600 | $5,000 | $52,600 |
| 2020 | $609 | $54,900 | $3,000 | $51,900 |
| 2019 | $609 | $54,900 | $3,000 | $51,900 |
| 2018 | $609 | $54,900 | $3,000 | $51,900 |
| 2017 | $609 | $54,900 | $3,000 | $51,900 |
| 2016 | $609 | $54,900 | $3,000 | $51,900 |
| 2015 | $609 | $18,200 | $3,000 | $15,200 |
| 2014 | $609 | $18,200 | $3,000 | $15,200 |
Source: Public Records
Map
Nearby Homes