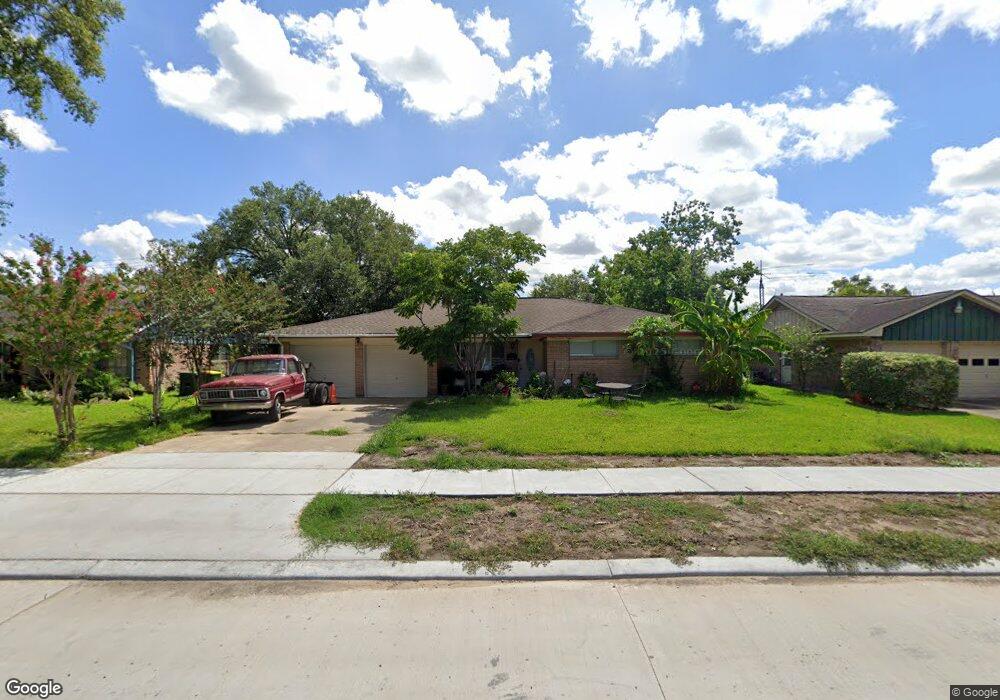
2109 Cedar St Pearland, TX 77581
Estimated Value: $265,963 - $289,000
--
Bed
2
Baths
1,558
Sq Ft
$179/Sq Ft
Est. Value
About This Home
This home is located at 2109 Cedar St, Pearland, TX 77581 and is currently estimated at $278,491, approximately $178 per square foot. 2109 Cedar St is a home located in Brazoria County with nearby schools including Barbara Cockrell Elementary School, Leon H. Sablatura Middle School, and Pearland Junior High School West.
Ownership History
Date
Name
Owned For
Owner Type
Purchase Details
Closed on
May 25, 2009
Sold by
Barcenas Homero and Barcenas Josefina
Bought by
Betancourt Maria Delaluz
Current Estimated Value
Home Financials for this Owner
Home Financials are based on the most recent Mortgage that was taken out on this home.
Original Mortgage
$126,957
Outstanding Balance
$79,825
Interest Rate
4.76%
Mortgage Type
FHA
Estimated Equity
$198,666
Purchase Details
Closed on
Nov 30, 2007
Sold by
Bean Jeffrey L
Bought by
Barcenas Homero
Home Financials for this Owner
Home Financials are based on the most recent Mortgage that was taken out on this home.
Original Mortgage
$110,700
Interest Rate
6.27%
Mortgage Type
Purchase Money Mortgage
Purchase Details
Closed on
Aug 7, 2007
Sold by
Hawk James P and Hawk Gary M
Bought by
Bean Jeffrey L
Purchase Details
Closed on
Dec 6, 2006
Sold by
Hawk James P
Bought by
Hawk James P and Hawk Gary M
Create a Home Valuation Report for This Property
The Home Valuation Report is an in-depth analysis detailing your home's value as well as a comparison with similar homes in the area
Home Values in the Area
Average Home Value in this Area
Purchase History
| Date | Buyer | Sale Price | Title Company |
|---|---|---|---|
| Betancourt Maria Delaluz | -- | Commonwealth Title | |
| Barcenas Homero | -- | American Title Company | |
| Bean Jeffrey L | -- | None Available | |
| Hawk James P | -- | None Available |
Source: Public Records
Mortgage History
| Date | Status | Borrower | Loan Amount |
|---|---|---|---|
| Open | Betancourt Maria Delaluz | $126,957 | |
| Previous Owner | Barcenas Homero | $110,700 |
Source: Public Records
Tax History Compared to Growth
Tax History
| Year | Tax Paid | Tax Assessment Tax Assessment Total Assessment is a certain percentage of the fair market value that is determined by local assessors to be the total taxable value of land and additions on the property. | Land | Improvement |
|---|---|---|---|---|
| 2025 | $954 | $262,335 | $34,380 | $229,170 |
| 2023 | $954 | $216,805 | $35,750 | $224,920 |
| 2022 | $4,741 | $197,095 | $35,750 | $173,880 |
| 2021 | $4,617 | $196,980 | $35,750 | $161,230 |
| 2020 | $4,395 | $169,480 | $27,500 | $141,980 |
| 2019 | $3,996 | $148,080 | $27,500 | $120,580 |
| 2018 | $4,066 | $151,310 | $27,500 | $123,810 |
| 2017 | $4,163 | $154,170 | $27,500 | $126,670 |
| 2016 | $3,926 | $154,170 | $27,500 | $126,670 |
| 2015 | $1,877 | $132,180 | $27,500 | $104,680 |
| 2014 | $1,877 | $120,840 | $27,500 | $93,340 |
Source: Public Records
Map
Nearby Homes
- 4610 & 4612 W Orange St
- 4804 W Plum St
- 2102 Pearland Ave
- 2245 N Austin Ave
- 2312 Willow Blvd
- 2315 Cedar St
- 2317 Cedar St
- 2321 Pearland Ave
- 2322 Francis Dr
- 5208 Cunningham Dr
- 4901 Shank Rd
- 2304 Lynn Dr
- 4615 W Walnut St
- 6420 Tindarey Creek Ln
- 17828 S Highway 35
- 2422-2436 S Main St
- 5013 Camden Ln
- 5602 Megan St
- 4609 Buescher Ct
- 0 Hatfield Rd Unit 37845028
- 2111 Cedar St
- 2107 Cedar St
- 2105 Cedar St
- 2113 Cedar St
- 2101 Cedar St
- 4602 Orange Cir N
- 2110 Cedar St
- 2108 Cedar St
- 2112 Cedar St
- 4640 Orange Cir S
- 2115 Cedar St
- 4604 Orange Cir N
- 2106 Cedar St
- 4606 Orange Cir N
- 4636 Orange Cir S
- 4603 Orange Cir N
- 2104 Cedar St
- 2117 Cedar St
- 4608 Orange Cir N
- 2116 Cedar St