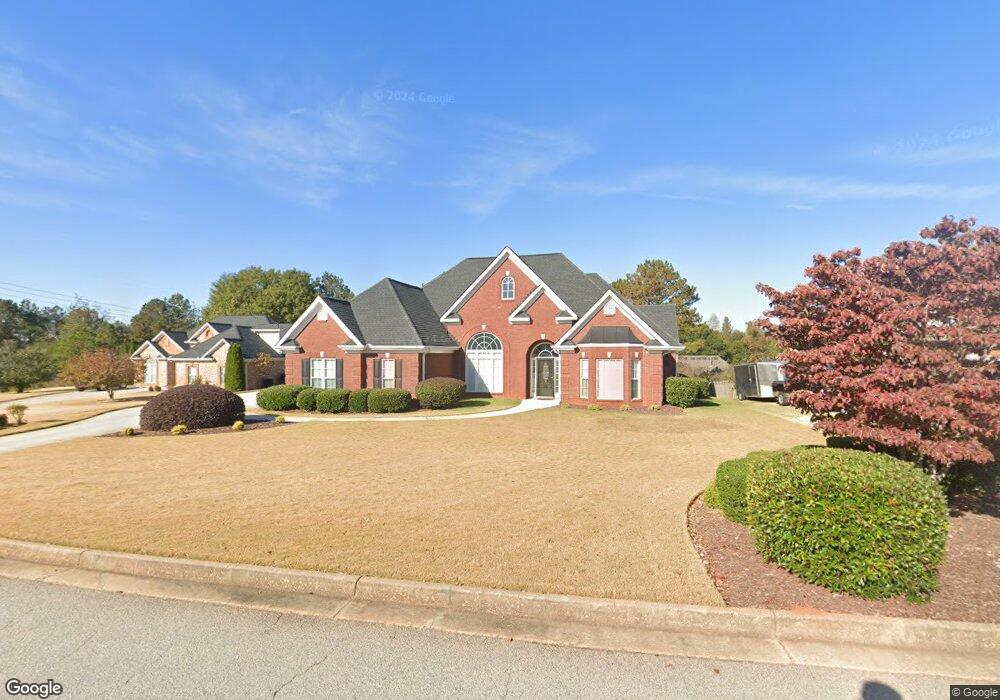
2109 Digby Ct SE Conyers, GA 30013
Estimated Value: $364,687 - $443,000
3
Beds
3
Baths
2,518
Sq Ft
$159/Sq Ft
Est. Value
About This Home
This home is located at 2109 Digby Ct SE, Conyers, GA 30013 and is currently estimated at $399,422, approximately $158 per square foot. 2109 Digby Ct SE is a home located in Rockdale County with nearby schools including Peek's Chapel Elementary School, Memorial Middle School, and Salem High School.
Ownership History
Date
Name
Owned For
Owner Type
Purchase Details
Closed on
Jun 29, 2010
Sold by
White Towana
Bought by
Walker Bruce T and Walker Hilary M
Current Estimated Value
Home Financials for this Owner
Home Financials are based on the most recent Mortgage that was taken out on this home.
Original Mortgage
$151,900
Outstanding Balance
$101,192
Interest Rate
4.77%
Mortgage Type
VA
Estimated Equity
$298,230
Purchase Details
Closed on
Sep 28, 2004
Sold by
Mathis Builders Inc
Bought by
White Towana
Home Financials for this Owner
Home Financials are based on the most recent Mortgage that was taken out on this home.
Original Mortgage
$224,974
Interest Rate
5.71%
Mortgage Type
VA
Purchase Details
Closed on
May 18, 2004
Sold by
T & T Unlmtd Invest Inc
Bought by
Mathis Bldrs Inc
Home Financials for this Owner
Home Financials are based on the most recent Mortgage that was taken out on this home.
Original Mortgage
$193,320
Interest Rate
5.77%
Create a Home Valuation Report for This Property
The Home Valuation Report is an in-depth analysis detailing your home's value as well as a comparison with similar homes in the area
Home Values in the Area
Average Home Value in this Area
Purchase History
| Date | Buyer | Sale Price | Title Company |
|---|---|---|---|
| Walker Bruce T | $151,900 | -- | |
| White Towana | $241,700 | -- | |
| Mathis Bldrs Inc | $40,000 | -- |
Source: Public Records
Mortgage History
| Date | Status | Borrower | Loan Amount |
|---|---|---|---|
| Open | Walker Bruce T | $151,900 | |
| Previous Owner | White Towana | $224,974 | |
| Previous Owner | Mathis Bldrs Inc | $193,320 |
Source: Public Records
Tax History Compared to Growth
Tax History
| Year | Tax Paid | Tax Assessment Tax Assessment Total Assessment is a certain percentage of the fair market value that is determined by local assessors to be the total taxable value of land and additions on the property. | Land | Improvement |
|---|---|---|---|---|
| 2024 | $4,364 | $173,520 | $34,720 | $138,800 |
| 2023 | $3,651 | $151,320 | $34,720 | $116,600 |
| 2022 | $2,906 | $122,320 | $21,640 | $100,680 |
| 2021 | $2,609 | $104,080 | $21,640 | $82,440 |
| 2020 | $2,761 | $105,800 | $21,800 | $84,000 |
| 2019 | $2,224 | $86,120 | $13,200 | $72,920 |
| 2018 | $2,177 | $84,120 | $13,200 | $70,920 |
| 2017 | $1,950 | $75,960 | $13,200 | $62,760 |
| 2016 | $1,743 | $73,920 | $13,200 | $60,720 |
| 2015 | $1,667 | $71,160 | $13,200 | $57,960 |
| 2014 | $1,424 | $68,520 | $10,560 | $57,960 |
| 2013 | -- | $89,240 | $24,640 | $64,600 |
Source: Public Records
Map
Nearby Homes
- 2052 Evergreen Dr SE
- 3111 Green Gate Way SE
- 3095 Brombley Dr SE
- 2585 Westchester Way SE
- 2791 Wellington Way SE Unit 1
- 1613 Brolington Ct
- 2638 Westchester Pkwy SE
- 3106 Brians Creek Dr SE
- 3113 Brians Creek Dr SE
- 3205 Haleys Way SE
- 1388 Fall River Dr
- 3226 Old Salem Rd SE
- 1115 Fountain Crest Dr
- 3225 Haleys Way SE
- 2513 Riverton Dr
- 3766 Windy Hill Dr SE Unit 2
- 2105 Digby Ct SE
- 2113 Digby Ct SE
- 0 Digby Ct SE Unit 8259814
- 3238 Leyland Way SE Unit 137
- 3238 Leyland Way SE
- 3242 Leyland Way SE
- 2117 Digby Ct SE
- 2061 Evergreen Dr SE
- 2061 Evergreen Dr SE Unit /139
- 2108 Digby Ct SE
- 2112 Digby Ct SE
- 2104 Digby Ct SE
- 3234 Leyland Way SE
- 3246 Leyland Way SE
- 2116 Digby Ct SE
- 2100 Digby Ct SE
- 3237 Leyland Way SE
- 2208 Jessowen Way SE Unit 1
- 2214 Jessowen Way SE
- 3250 Leyland Way SE