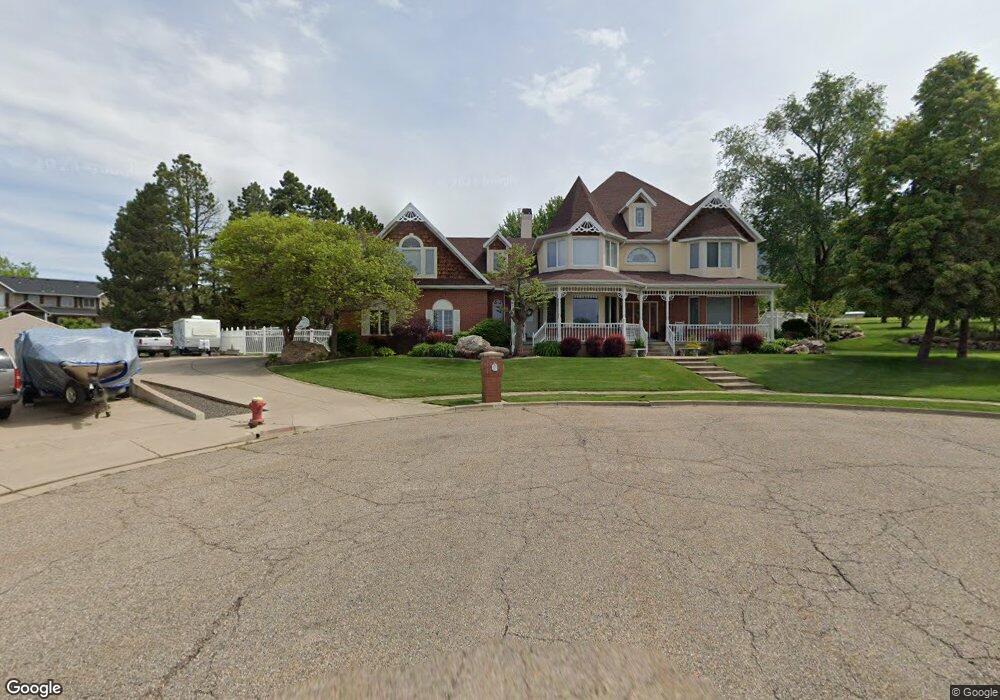
2109 E 200 S Layton, UT 84040
Estimated Value: $974,000 - $1,330,518
4
Beds
5
Baths
5,147
Sq Ft
$225/Sq Ft
Est. Value
About This Home
This home is located at 2109 E 200 S, Layton, UT 84040 and is currently estimated at $1,159,880, approximately $225 per square foot. 2109 E 200 S is a home located in Davis County with nearby schools including Morgan Elementary School, Fairfield Junior High School, and Layton High School.
Ownership History
Date
Name
Owned For
Owner Type
Purchase Details
Closed on
Apr 11, 2005
Sold by
Rasmussen Meryl K
Bought by
Rasmussen Brent E and Rasmussen Meryl K
Current Estimated Value
Home Financials for this Owner
Home Financials are based on the most recent Mortgage that was taken out on this home.
Original Mortgage
$199,500
Interest Rate
5.77%
Mortgage Type
New Conventional
Purchase Details
Closed on
Oct 3, 2003
Sold by
Rasmussen Brent E and Rasmussen Meryl K
Bought by
Rasmussen Meryl K
Home Financials for this Owner
Home Financials are based on the most recent Mortgage that was taken out on this home.
Original Mortgage
$198,642
Interest Rate
6.4%
Mortgage Type
Purchase Money Mortgage
Purchase Details
Closed on
Mar 2, 1999
Sold by
Rasmussen Brent E
Bought by
Rasmussen Meryl K
Home Financials for this Owner
Home Financials are based on the most recent Mortgage that was taken out on this home.
Original Mortgage
$205,500
Interest Rate
6.76%
Create a Home Valuation Report for This Property
The Home Valuation Report is an in-depth analysis detailing your home's value as well as a comparison with similar homes in the area
Home Values in the Area
Average Home Value in this Area
Purchase History
| Date | Buyer | Sale Price | Title Company |
|---|---|---|---|
| Rasmussen Brent E | -- | Bonneville Title Company | |
| Rasmussen Meryl K | -- | First American Title Co | |
| Rasmussen Brent E | -- | First American Title Co | |
| Rasmussen Meryl K | -- | Bonneville Title Company Inc | |
| Rasmussen Brent E | -- | Bonneville Title Company Inc |
Source: Public Records
Mortgage History
| Date | Status | Borrower | Loan Amount |
|---|---|---|---|
| Closed | Rasmussen Brent E | $199,500 | |
| Closed | Rasmussen Brent E | $198,642 | |
| Closed | Rasmussen Brent E | $205,500 |
Source: Public Records
Tax History
| Year | Tax Paid | Tax Assessment Tax Assessment Total Assessment is a certain percentage of the fair market value that is determined by local assessors to be the total taxable value of land and additions on the property. | Land | Improvement |
|---|---|---|---|---|
| 2025 | $6,113 | $596,200 | $221,482 | $374,718 |
| 2024 | $5,685 | $561,550 | $224,557 | $336,993 |
| 2023 | $5,686 | $1,000,000 | $267,108 | $732,892 |
| 2022 | $5,923 | $568,701 | $146,251 | $422,450 |
| 2021 | $5,505 | $787,000 | $227,433 | $559,567 |
| 2020 | $5,099 | $698,000 | $204,708 | $493,292 |
| 2019 | $5,056 | $681,000 | $178,248 | $502,752 |
| 2018 | $4,651 | $629,000 | $156,140 | $472,860 |
| 2016 | $4,563 | $323,125 | $78,422 | $244,703 |
| 2015 | $4,267 | $288,145 | $78,422 | $209,723 |
| 2014 | $4,280 | $297,614 | $78,422 | $219,192 |
| 2013 | -- | $250,686 | $49,880 | $200,806 |
Source: Public Records
Map
Nearby Homes
- 2382 Summerwood Dr
- 882 E Windsor Ln N
- 1109 Sherwood Dr
- 1690 E Gentile St
- 1328 E Orchard Ridge Ln
- 2877 E Gentile St Unit 2
- 250 E 950 N
- 378 N Thurston Ln
- 1515 E Gentile St
- 1368 E 275 S
- 1273 Newport Ln
- 888 Thornfield Rd
- 1202 E Mutton Hollow Rd
- 1137 Holmes Creek Ln
- 133 Blue Sage Ln
- 425 E 500 N
- 1494 Orchard Ridge Ln Unit 315
- 1503 E 530 N
- 1048 N Kensington Heights
- 1390 Orchard Ridge Ln
Your Personal Tour Guide
Ask me questions while you tour the home.