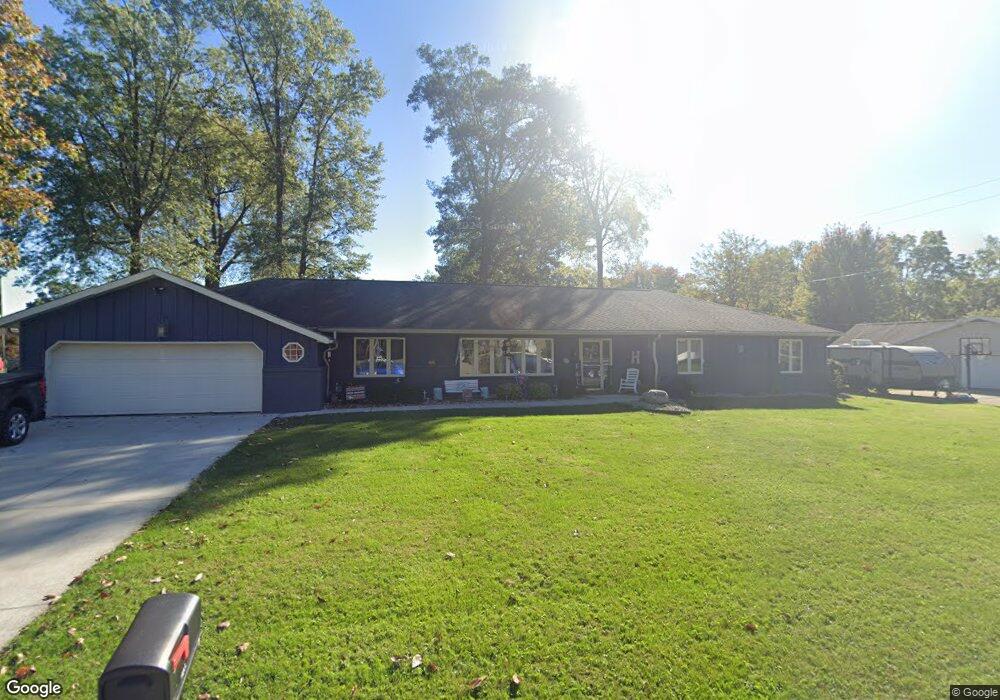
2109 High Ridge Rd Lima, OH 45805
Estimated Value: $296,000 - $334,132
4
Beds
4
Baths
2,262
Sq Ft
$141/Sq Ft
Est. Value
About This Home
This home is located at 2109 High Ridge Rd, Lima, OH 45805 and is currently estimated at $319,533, approximately $141 per square foot. 2109 High Ridge Rd is a home located in Allen County with nearby schools including Maplewood Elementary School, Elmwood Elementary School, and Shawnee Middle School.
Ownership History
Date
Name
Owned For
Owner Type
Purchase Details
Closed on
Apr 14, 2020
Sold by
Schaublin Rosemarie
Bought by
Hull Michael D and Hull Patricia M
Current Estimated Value
Home Financials for this Owner
Home Financials are based on the most recent Mortgage that was taken out on this home.
Original Mortgage
$171,000
Outstanding Balance
$152,849
Interest Rate
3.3%
Mortgage Type
New Conventional
Estimated Equity
$166,684
Purchase Details
Closed on
Aug 31, 1998
Sold by
George Carl
Bought by
Schaublin David and Schaublin Rosemarie
Home Financials for this Owner
Home Financials are based on the most recent Mortgage that was taken out on this home.
Original Mortgage
$70,000
Interest Rate
7.03%
Mortgage Type
New Conventional
Purchase Details
Closed on
Mar 1, 1978
Bought by
Dalton George Carl
Create a Home Valuation Report for This Property
The Home Valuation Report is an in-depth analysis detailing your home's value as well as a comparison with similar homes in the area
Home Values in the Area
Average Home Value in this Area
Purchase History
| Date | Buyer | Sale Price | Title Company |
|---|---|---|---|
| Hull Michael D | $180,000 | None Available | |
| Schaublin David | $171,500 | -- | |
| Dalton George Carl | $79,500 | -- |
Source: Public Records
Mortgage History
| Date | Status | Borrower | Loan Amount |
|---|---|---|---|
| Open | Hull Michael D | $171,000 | |
| Closed | Schaublin David | $70,000 |
Source: Public Records
Tax History Compared to Growth
Tax History
| Year | Tax Paid | Tax Assessment Tax Assessment Total Assessment is a certain percentage of the fair market value that is determined by local assessors to be the total taxable value of land and additions on the property. | Land | Improvement |
|---|---|---|---|---|
| 2024 | $4,389 | $89,990 | $16,980 | $73,010 |
| 2023 | $4,062 | $73,150 | $13,790 | $59,360 |
| 2022 | $4,078 | $73,150 | $13,790 | $59,360 |
| 2021 | $4,096 | $73,150 | $13,790 | $59,360 |
| 2020 | $2,652 | $63,600 | $13,090 | $50,510 |
| 2019 | $2,652 | $63,600 | $13,090 | $50,510 |
| 2018 | $2,540 | $63,600 | $13,090 | $50,510 |
| 2017 | $2,405 | $57,020 | $13,090 | $43,930 |
| 2016 | $2,381 | $57,020 | $13,090 | $43,930 |
| 2015 | $2,509 | $57,020 | $13,090 | $43,930 |
| 2014 | $2,509 | $59,120 | $12,570 | $46,550 |
| 2013 | $2,461 | $59,120 | $12,570 | $46,550 |
Source: Public Records
Map
Nearby Homes
- 3410 Greens Rd
- 115 Lanes End
- 2320 London Dr
- 1624 Pro Dr
- 0 Colonial Ln
- 3220 Fort Amanda Rd
- 2632 Alexandria Dr
- 1446 Adak Ave
- 3128 Clifford Dr
- 1453 W Shore Dr
- 1424 Loch Loman Way
- 1440 Riverview Dr
- 1911 Wonderlick Rd
- 4211 Fort Amanda Rd
- 3031 Yoakam Rd
- 1408 Winghaven Dr
- 3390 Spencerville Rd
- 2227 Seneca Dr
- 0 Zurmehly Rd
- 1340 Wonderlick Rd