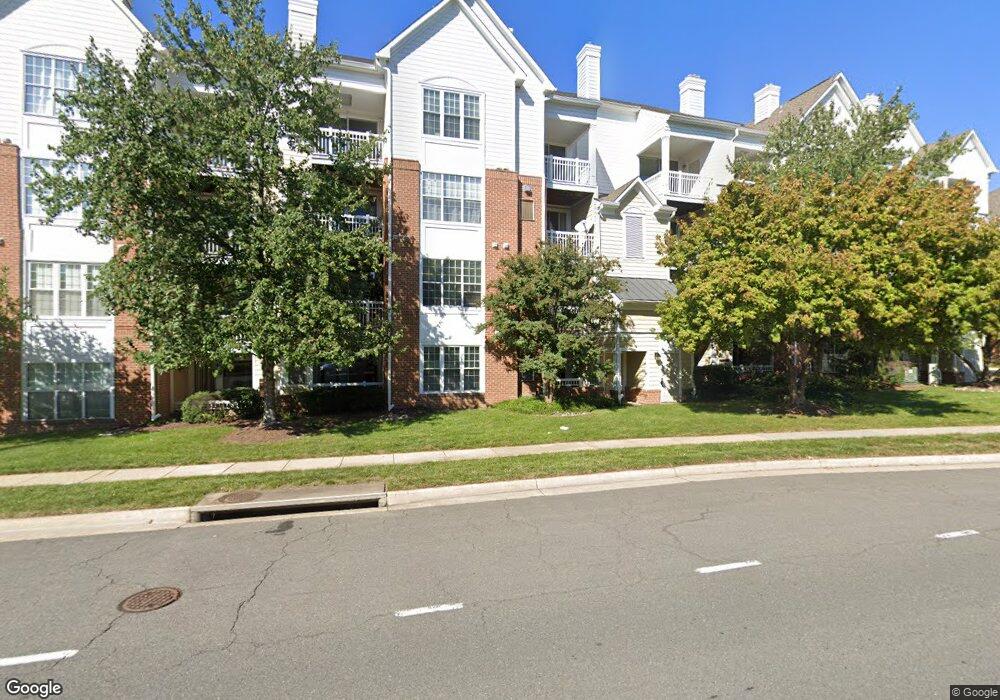
2109 Highcourt Ln Unit 102 Herndon, VA 20170
Estimated Value: $273,000 - $303,000
1
Bed
1
Bath
810
Sq Ft
$356/Sq Ft
Est. Value
About This Home
This home is located at 2109 Highcourt Ln Unit 102, Herndon, VA 20170 and is currently estimated at $288,031, approximately $355 per square foot. 2109 Highcourt Ln Unit 102 is a home located in Fairfax County with nearby schools including L.L. Coates Elementary School, Herndon Middle School, and Herndon High School.
Ownership History
Date
Name
Owned For
Owner Type
Purchase Details
Closed on
Nov 9, 2011
Sold by
Degurse John L
Bought by
Emmanuel Alex A
Current Estimated Value
Home Financials for this Owner
Home Financials are based on the most recent Mortgage that was taken out on this home.
Original Mortgage
$124,125
Outstanding Balance
$84,600
Interest Rate
4.01%
Mortgage Type
New Conventional
Estimated Equity
$203,431
Purchase Details
Closed on
May 10, 2002
Sold by
Posner Lysa
Bought by
Degurse John
Home Financials for this Owner
Home Financials are based on the most recent Mortgage that was taken out on this home.
Original Mortgage
$90,400
Interest Rate
7.18%
Mortgage Type
New Conventional
Purchase Details
Closed on
Mar 3, 1998
Sold by
Walker Lydon Jessica
Bought by
Posner Lysa P
Home Financials for this Owner
Home Financials are based on the most recent Mortgage that was taken out on this home.
Original Mortgage
$75,250
Interest Rate
6.85%
Mortgage Type
FHA
Create a Home Valuation Report for This Property
The Home Valuation Report is an in-depth analysis detailing your home's value as well as a comparison with similar homes in the area
Home Values in the Area
Average Home Value in this Area
Purchase History
| Date | Buyer | Sale Price | Title Company |
|---|---|---|---|
| Emmanuel Alex A | $165,500 | -- | |
| Degurse John | $113,500 | -- | |
| Posner Lysa P | $77,000 | -- |
Source: Public Records
Mortgage History
| Date | Status | Borrower | Loan Amount |
|---|---|---|---|
| Open | Emmanuel Alex A | $124,125 | |
| Previous Owner | Degurse John | $90,400 | |
| Previous Owner | Posner Lysa P | $75,250 |
Source: Public Records
Tax History Compared to Growth
Tax History
| Year | Tax Paid | Tax Assessment Tax Assessment Total Assessment is a certain percentage of the fair market value that is determined by local assessors to be the total taxable value of land and additions on the property. | Land | Improvement |
|---|---|---|---|---|
| 2025 | $3,462 | $261,180 | $52,000 | $209,180 |
| 2024 | $3,462 | $244,090 | $49,000 | $195,090 |
| 2023 | $3,109 | $223,940 | $45,000 | $178,940 |
| 2022 | $2,976 | $211,260 | $42,000 | $169,260 |
| 2021 | $2,384 | $203,130 | $41,000 | $162,130 |
| 2020 | $2,290 | $193,460 | $39,000 | $154,460 |
| 2019 | $2,150 | $181,700 | $36,000 | $145,700 |
| 2018 | $2,069 | $179,900 | $36,000 | $143,900 |
| 2017 | $2,008 | $172,980 | $35,000 | $137,980 |
| 2016 | $1,930 | $166,630 | $33,000 | $133,630 |
| 2015 | $1,860 | $166,630 | $33,000 | $133,630 |
| 2014 | $1,787 | $160,490 | $32,000 | $128,490 |
Source: Public Records
Map
Nearby Homes
- 2111 Highcourt Ln Unit 302
- 2204 Westcourt Ln Unit 318
- 2204 Westcourt Ln Unit 109
- 2204 Westcourt Ln Unit 116
- 2204 Westcourt Ln Unit 201
- 12913 Alton Square Unit 219
- 12919 Alton Square Unit 215
- 12919 Alton Square Unit 117
- 12919 Alton Square Unit 116
- 12901 Alton Square Unit 102
- 12915 Alton Square Unit 416
- 12915 Alton Square Unit 117
- 12880 Mosaic Park Way Unit 1-X
- 12850 Mosaic Way Unit 2U
- 312 Holly Ct
- 12865 Mosaic Park Way Unit 3Y
- 12953 Centre Park Cir Unit 218
- 12953 Centre Park Cir Unit 222
- 12958 Centre Park Cir Unit 219
- 12956 Centre Park Cir Unit 417
- 2109 Highcourt Ln Unit 301
- 2109 Highcourt Ln Unit 201
- 2109 Highcourt Ln Unit 305
- 2109 Highcourt Ln
- 2109 Highcourt Ln Unit 101
- 2109 Highcourt Ln Unit 302
- 2111 Highcourt Ln Unit 305
- 2111 Highcourt Ln Unit 103
- 2111 Highcourt Ln Unit 101
- 2111 Highcourt Ln Unit 201
- 2111 Highcourt Ln Unit 202
- 2111 Highcourt Ln Unit 304
- 2107 Highcourt Ln Unit 302
- 2107 Highcourt Ln Unit 305
- 2107 Highcourt Ln Unit 303
- 2107 Highcourt Ln Unit 103
- 2107 Highcourt Ln Unit 203
- 2107 Highcourt Ln Unit 201
- 2107 Highcourt Ln Unit 202
- 2107 Highcourt Ln Unit 102