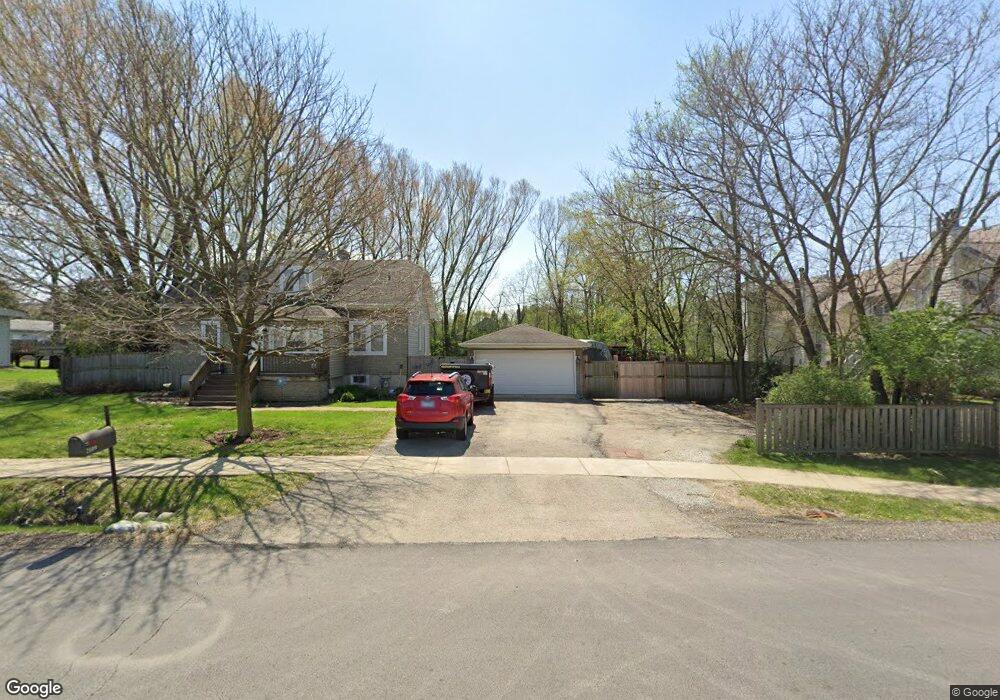
2109 Inverness Ave Downers Grove, IL 60515
Belmont NeighborhoodEstimated Value: $414,000 - $522,211
4
Beds
2
Baths
2,595
Sq Ft
$179/Sq Ft
Est. Value
About This Home
This home is located at 2109 Inverness Ave, Downers Grove, IL 60515 and is currently estimated at $463,803, approximately $178 per square foot. 2109 Inverness Ave is a home located in DuPage County with nearby schools including Henry Puffer School, Herrick Middle School, and Downer Grove North High School.
Ownership History
Date
Name
Owned For
Owner Type
Purchase Details
Closed on
Oct 30, 2017
Sold by
Raudys Aurimas and Gaucyte Asta
Bought by
Jimenez Edna A and Jimenez Jesus
Current Estimated Value
Home Financials for this Owner
Home Financials are based on the most recent Mortgage that was taken out on this home.
Original Mortgage
$287,730
Outstanding Balance
$242,803
Interest Rate
4.12%
Mortgage Type
New Conventional
Estimated Equity
$221,000
Purchase Details
Closed on
May 13, 2005
Sold by
Mathews William and Mathews Angela
Bought by
Raudys Aurimas
Home Financials for this Owner
Home Financials are based on the most recent Mortgage that was taken out on this home.
Original Mortgage
$200,400
Interest Rate
7.75%
Mortgage Type
Fannie Mae Freddie Mac
Purchase Details
Closed on
Jul 29, 1996
Sold by
Harris Bank Hinsdale
Bought by
Mathews William and Mathews Angela
Home Financials for this Owner
Home Financials are based on the most recent Mortgage that was taken out on this home.
Original Mortgage
$108,750
Interest Rate
7.6%
Create a Home Valuation Report for This Property
The Home Valuation Report is an in-depth analysis detailing your home's value as well as a comparison with similar homes in the area
Home Values in the Area
Average Home Value in this Area
Purchase History
| Date | Buyer | Sale Price | Title Company |
|---|---|---|---|
| Jimenez Edna A | $320,000 | Chicago Title Insurance Comp | |
| Raudys Aurimas | $250,500 | -- | |
| Mathews William | $95,000 | -- |
Source: Public Records
Mortgage History
| Date | Status | Borrower | Loan Amount |
|---|---|---|---|
| Open | Jimenez Edna A | $287,730 | |
| Previous Owner | Raudys Aurimas | $200,400 | |
| Previous Owner | Mathews William | $108,750 | |
| Closed | Raudys Aurimas | $50,100 |
Source: Public Records
Tax History Compared to Growth
Tax History
| Year | Tax Paid | Tax Assessment Tax Assessment Total Assessment is a certain percentage of the fair market value that is determined by local assessors to be the total taxable value of land and additions on the property. | Land | Improvement |
|---|---|---|---|---|
| 2024 | $6,805 | $126,981 | $40,311 | $86,670 |
| 2023 | $6,426 | $115,890 | $36,790 | $79,100 |
| 2022 | $6,143 | $110,370 | $35,040 | $75,330 |
| 2021 | $5,595 | $106,190 | $33,710 | $72,480 |
| 2020 | $5,503 | $104,280 | $33,100 | $71,180 |
| 2019 | $5,313 | $99,770 | $31,670 | $68,100 |
| 2018 | $5,022 | $93,380 | $29,640 | $63,740 |
| 2017 | $3,154 | $60,430 | $28,640 | $31,790 |
| 2016 | $3,115 | $58,240 | $27,600 | $30,640 |
| 2015 | $3,071 | $54,840 | $25,990 | $28,850 |
| 2014 | $3,036 | $52,860 | $25,050 | $27,810 |
| 2013 | $2,998 | $52,990 | $25,110 | $27,880 |
Source: Public Records
Map
Nearby Homes
- 5431 Ashbrook Place Unit 8
- 5434 Ashbrook Place
- 5509 Aspen Ave Unit 6
- 2160 Howard Ave
- 5538 Durand Dr
- 2335 Old George Way Unit 2335
- 5617 Durand Dr Unit 9A
- 5616 Durand Dr Unit 6D
- 5622 Belmont Rd
- 2605 Maple Ave
- 2749 College Rd
- 1903 Maple Ave
- 2800 Maple Ave Unit 31C
- 5727 Woodward Ave
- 5760 Woodward Ave
- 5540 Walnut Ave Unit 4A
- 5540 Walnut Ave Unit 15B
- 5454 Lee Ave
- 2900 Maple Ave Unit 13C
- 2900 Maple Ave Unit 19E
- 2105 Inverness Ave
- 5419 Ashbrook Place Unit 2
- 5421 Ashbrook Place
- 5423 Ashbrook Place Unit 4
- 5417 Ashbrook Place Unit 1
- 5427 Ashbrook Place Unit 6
- 5429 Ashbrook Place Unit 7
- 5425 Ashbrook Place Unit 33
- 2103 Inverness Ave
- 5439 Ashbrook Place
- 5439 Ashbrook Place Unit 12
- 5439 Ashbrook Place Unit 9
- 5441 Ashbrook Place Unit 13
- 5435 Ashbrook Place Unit 10
- 5437 Ashbrook Place Unit 11
- 5433 Ashbrook Place Unit 515
- 5433 Ashbrook Place
- 2101 Inverness Ave
- 5420 Ashbrook Place Unit 48
- 5422 Ashbrook Place