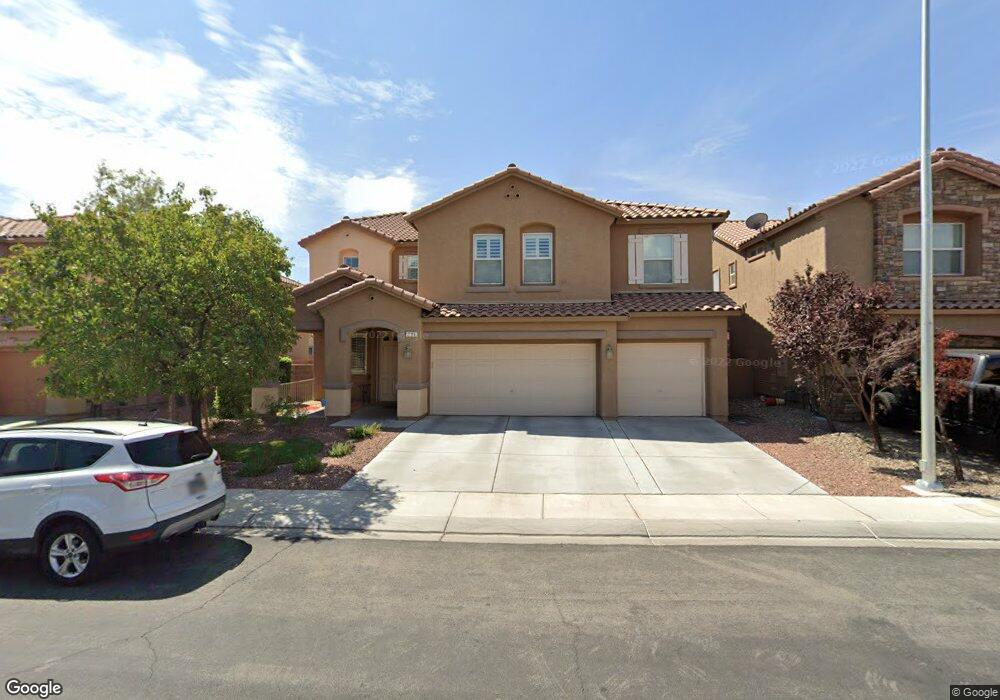
2109 Mistle Thrush Dr North Las Vegas, NV 89084
Aliante NeighborhoodEstimated Value: $637,696 - $649,000
5
Beds
4
Baths
3,752
Sq Ft
$171/Sq Ft
Est. Value
About This Home
This home is located at 2109 Mistle Thrush Dr, North Las Vegas, NV 89084 and is currently estimated at $642,924, approximately $171 per square foot. 2109 Mistle Thrush Dr is a home located in Clark County with nearby schools including Goynes Elementary School, Brian & Teri Cram Middle School, and Legacy High School.
Ownership History
Date
Name
Owned For
Owner Type
Purchase Details
Closed on
Jul 14, 2025
Sold by
Garcia Andrew J and Garcia Kimberly M
Bought by
Mccoy-Garcia Family Revocable Living Trust and Garcia
Current Estimated Value
Purchase Details
Closed on
Sep 12, 2011
Sold by
Montesa Llc
Bought by
Garcia Andrew J and Garcia Kimberly M
Home Financials for this Owner
Home Financials are based on the most recent Mortgage that was taken out on this home.
Original Mortgage
$213,968
Interest Rate
3.75%
Mortgage Type
FHA
Purchase Details
Closed on
Mar 28, 2011
Sold by
Anand Harveer S
Bought by
Montesa Llc
Purchase Details
Closed on
Mar 3, 2004
Sold by
Kb Home Nevada Inc
Bought by
Anand Harveer S
Home Financials for this Owner
Home Financials are based on the most recent Mortgage that was taken out on this home.
Original Mortgage
$250,600
Interest Rate
5.61%
Mortgage Type
Unknown
Create a Home Valuation Report for This Property
The Home Valuation Report is an in-depth analysis detailing your home's value as well as a comparison with similar homes in the area
Home Values in the Area
Average Home Value in this Area
Purchase History
| Date | Buyer | Sale Price | Title Company |
|---|---|---|---|
| Mccoy-Garcia Family Revocable Living Trust | -- | None Listed On Document | |
| Garcia Andrew J | $223,000 | National Title Company | |
| Montesa Llc | $175,000 | National Title Company | |
| Anand Harveer S | $278,463 | First American Title Co Of |
Source: Public Records
Mortgage History
| Date | Status | Borrower | Loan Amount |
|---|---|---|---|
| Previous Owner | Garcia Andrew J | $213,968 | |
| Previous Owner | Anand Harveer S | $250,600 |
Source: Public Records
Tax History Compared to Growth
Tax History
| Year | Tax Paid | Tax Assessment Tax Assessment Total Assessment is a certain percentage of the fair market value that is determined by local assessors to be the total taxable value of land and additions on the property. | Land | Improvement |
|---|---|---|---|---|
| 2025 | $3,397 | $195,950 | $38,850 | $157,100 |
| 2024 | $3,298 | $195,950 | $38,850 | $157,100 |
| 2023 | $3,298 | $185,610 | $37,450 | $148,160 |
| 2022 | $3,203 | $168,043 | $32,900 | $135,143 |
| 2021 | $3,109 | $156,183 | $28,000 | $128,183 |
| 2020 | $3,016 | $155,707 | $29,050 | $126,657 |
| 2019 | $2,979 | $141,063 | $26,250 | $114,813 |
| 2018 | $2,843 | $129,096 | $19,250 | $109,846 |
| 2017 | $4,099 | $122,187 | $19,250 | $102,937 |
| 2016 | $2,661 | $94,236 | $14,000 | $80,236 |
| 2015 | $2,223 | $74,863 | $12,250 | $62,613 |
| 2014 | $2,154 | $62,302 | $8,750 | $53,552 |
Source: Public Records
Map
Nearby Homes
- 2109 Silvereye Dr
- 2120 Marsh Tern Ct
- 6720 Sand Swallow St
- 2312 Scissortail Ct
- 2208 Saddlebill Ct
- 2420 Mountain Rail Dr
- 6736 Sugarbird Ct
- 6528 Chebec St
- 6732 Arrow Hill St
- 6420 Indian Peak Ct
- 1821 Azure Oak Ave
- 6417 Giant Oak St
- 6405 Sea Swallow St
- 6828 Arden Glade Ct
- 1777 Gentle Brook St
- 2208 Baywater Ave
- 6908 Forest Gate St
- 6908 Fox Sparrow Ct
- 6532 Bright Morning St
- 6837 Empire Cliff St
- 2113 Mistle Thrush Dr
- 2105 Mistle Thrush Dr
- 2108 Marsh Tern Ct
- 2112 Marsh Tern Ct
- 2104 Marsh Tern Ct
- 2117 Mistle Thrush Dr
- 2108 Mistle Thrush Dr
- 2116 Marsh Tern Ct
- 2112 Mistle Thrush Dr
- 2104 Mistle Thrush Dr
- 2116 Mistle Thrush Dr
- 2121 Mistle Thrush Dr
- 6608 Sea Swallow St
- 6612 Sea Swallow St
- 6604 Sea Swallow St
- 6616 Sea Swallow St
- 2120 Mistle Thrush Dr
- 2109 Marsh Tern Ct
- 2124 Marsh Tern Ct
- 2113 Marsh Tern Ct