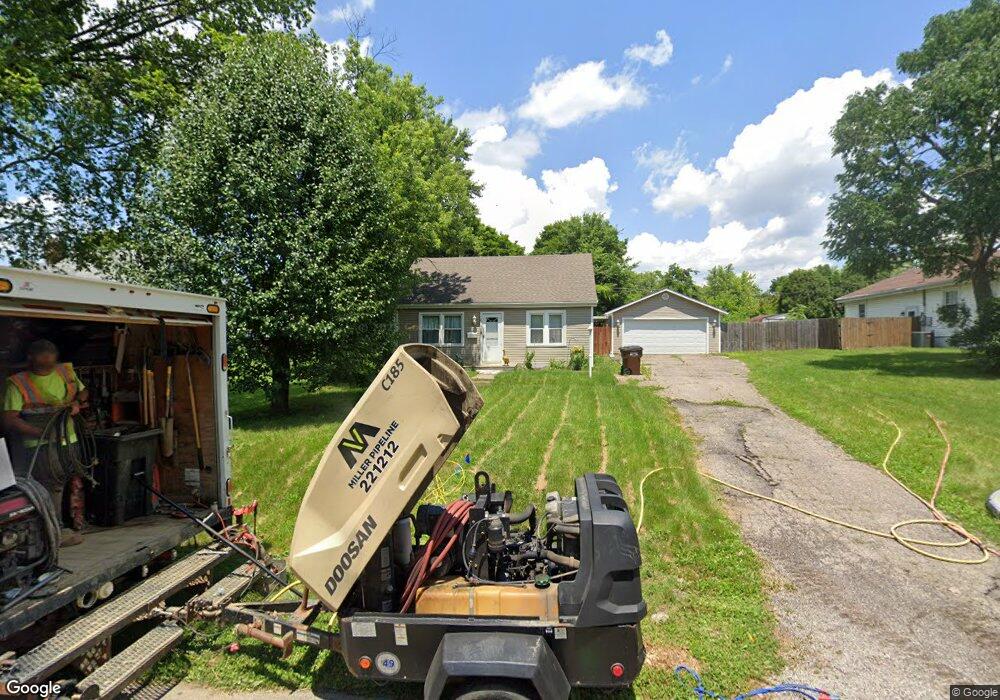
2109 Nomad Ave Dayton, OH 45414
Northridge NeighborhoodEstimated Value: $111,197 - $145,000
3
Beds
1
Bath
1,019
Sq Ft
$128/Sq Ft
Est. Value
About This Home
This home is located at 2109 Nomad Ave, Dayton, OH 45414 and is currently estimated at $130,049, approximately $127 per square foot. 2109 Nomad Ave is a home located in Montgomery County with nearby schools including Northridge High School, Horizon Science Academy-Dayton Elementary School, and Horizon Science Academy Dayton High School.
Ownership History
Date
Name
Owned For
Owner Type
Purchase Details
Closed on
Aug 12, 2021
Sold by
Willis Richard S and Willis Linda M
Bought by
Baird Kathleen G
Current Estimated Value
Home Financials for this Owner
Home Financials are based on the most recent Mortgage that was taken out on this home.
Original Mortgage
$104,760
Outstanding Balance
$95,116
Interest Rate
2.8%
Mortgage Type
New Conventional
Estimated Equity
$34,933
Purchase Details
Closed on
Mar 25, 2021
Sold by
Hansgen Andrew S and Hansgen Ashley
Bought by
Willis Richard S and Willis Linda M
Purchase Details
Closed on
May 30, 2003
Sold by
Courts Joseph A and Courts Gina R
Bought by
Hansgen Andrew S
Home Financials for this Owner
Home Financials are based on the most recent Mortgage that was taken out on this home.
Original Mortgage
$61,042
Interest Rate
5.78%
Mortgage Type
FHA
Create a Home Valuation Report for This Property
The Home Valuation Report is an in-depth analysis detailing your home's value as well as a comparison with similar homes in the area
Home Values in the Area
Average Home Value in this Area
Purchase History
| Date | Buyer | Sale Price | Title Company |
|---|---|---|---|
| Baird Kathleen G | $108,000 | Fidelity Lawyers Ttl Agcy Ll | |
| Willis Richard S | $38,800 | None Available | |
| Hansgen Andrew S | $62,000 | -- |
Source: Public Records
Mortgage History
| Date | Status | Borrower | Loan Amount |
|---|---|---|---|
| Open | Baird Kathleen G | $104,760 | |
| Previous Owner | Hansgen Andrew S | $61,042 |
Source: Public Records
Tax History Compared to Growth
Tax History
| Year | Tax Paid | Tax Assessment Tax Assessment Total Assessment is a certain percentage of the fair market value that is determined by local assessors to be the total taxable value of land and additions on the property. | Land | Improvement |
|---|---|---|---|---|
| 2024 | $1,978 | $24,390 | $5,660 | $18,730 |
| 2023 | $1,978 | $24,390 | $5,660 | $18,730 |
| 2022 | $1,946 | $18,370 | $4,040 | $14,330 |
| 2021 | $2,133 | $18,370 | $4,040 | $14,330 |
| 2020 | $2,187 | $18,370 | $4,040 | $14,330 |
| 2019 | $1,899 | $14,130 | $4,040 | $10,090 |
| 2018 | $1,918 | $14,130 | $4,040 | $10,090 |
| 2017 | $1,796 | $14,130 | $4,040 | $10,090 |
| 2016 | $1,644 | $13,220 | $4,040 | $9,180 |
| 2015 | $1,392 | $13,220 | $4,040 | $9,180 |
| 2014 | $1,392 | $13,220 | $4,040 | $9,180 |
| 2012 | -- | $14,780 | $5,330 | $9,450 |
Source: Public Records
Map
Nearby Homes
- 2021 Gipsy Dr
- 2160 Martin Ave
- 2010 Gipsy Dr
- 2024 Kildare Ave
- 2100 Harding Ave
- 2304 Homesite Dr
- 2127 Marker Ave
- 2203 Arthur Ave
- 5586 Wadsworth Rd
- 2006 High Knoll Dr
- 1657 Scenic Dr
- 2110 Needmore Rd
- 6020 Volkman Dr
- 2315 Rector Ave
- 2216 Rector Ave
- 6114 Miller Ln
- 2246 Woodson Dr
- 2625 Secretariat Ct
- 1376 Bartley Rd
- 1742 Eric Dr
- 2105 Nomad Ave
- 2121 Nomad Ave
- 2101 Nomad Ave
- 2122 Martin Ave
- 2102 Martin Ave
- 2089 Nomad Ave
- 2125 Nomad Ave
- 2106 Nomad Ave
- 2110 Nomad Ave
- 2114 Nomad Ave
- 2118 Nomad Ave
- 2100 Nomad Ave
- 2126 Martin Ave
- 2017 Nomad Ave
- 2139 Nomad Ave
- 2090 Nomad Ave
- 2030 Martin Ave
- 2108 Nomad Ave
- 2134 Martin Ave
- 2020 Nomad Ave