Estimated Value: $492,000 - $510,000
3
Beds
4
Baths
1,632
Sq Ft
$308/Sq Ft
Est. Value
About This Home
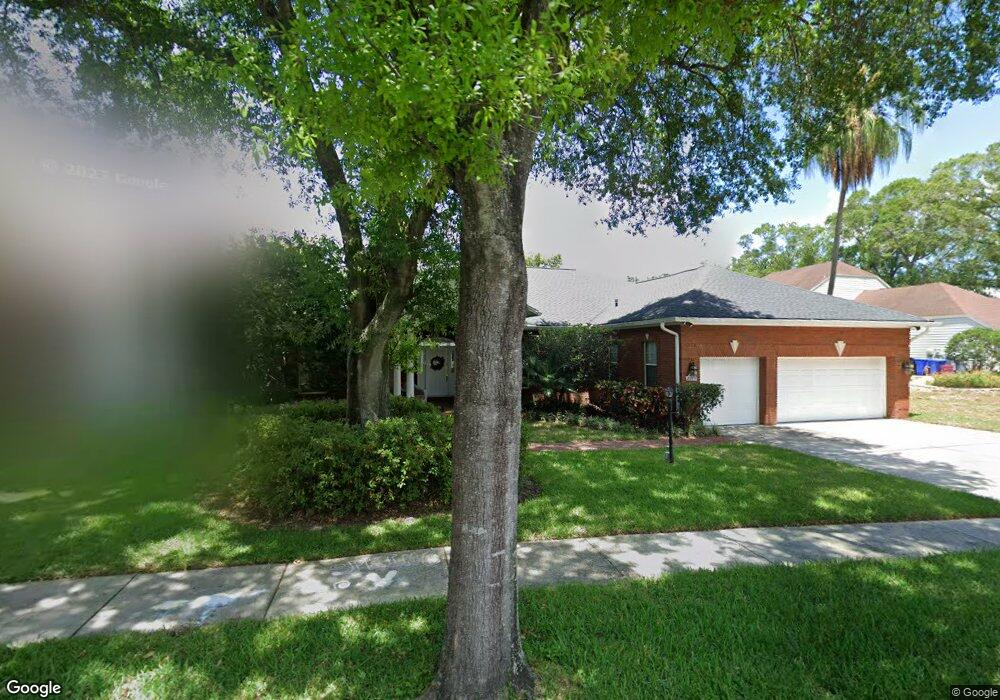
This home is located at 2109 S Fore Cir, Tampa, FL 33612 and is currently estimated at $502,679, approximately $308 per square foot. 2109 S Fore Cir is a home located in Hillsborough County with nearby schools including Lake Magdalene Elementary School, Adams Middle School, and Chamberlain High School.
Ownership History
Date
Name
Owned For
Owner Type
Purchase Details
Closed on
Sep 3, 2014
Sold by
Ernst Mark and Ernst Susan
Bought by
Velasquez Stephanie L and Wolas Tyler S
Current Estimated Value
Home Financials for this Owner
Home Financials are based on the most recent Mortgage that was taken out on this home.
Original Mortgage
$216,900
Outstanding Balance
$166,235
Interest Rate
4.17%
Mortgage Type
New Conventional
Estimated Equity
$336,444
Purchase Details
Closed on
Jan 31, 2006
Sold by
Wolf Boyd
Bought by
Ernst Mark L
Purchase Details
Closed on
Jul 29, 2004
Sold by
Mcclellan Brian D and Mcclellan Brenda M
Bought by
Ernst Mark
Purchase Details
Closed on
May 25, 2004
Sold by
Blankenship Jay and Blankenship Kathleen
Bought by
Ernst Mark and Ernst Susan
Home Financials for this Owner
Home Financials are based on the most recent Mortgage that was taken out on this home.
Original Mortgage
$180,000
Interest Rate
6.37%
Mortgage Type
Unknown
Create a Home Valuation Report for This Property
The Home Valuation Report is an in-depth analysis detailing your home's value as well as a comparison with similar homes in the area
Home Values in the Area
Average Home Value in this Area
Purchase History
| Date | Buyer | Sale Price | Title Company |
|---|---|---|---|
| Velasquez Stephanie L | $216,900 | Fairview Title Company | |
| Ernst Mark L | $63,400 | Wingate Title Llc | |
| Ernst Mark L | $63,400 | Wingate Title Llc | |
| Ernst Mark | -- | -- | |
| Ernst Mark | $200,000 | -- |
Source: Public Records
Mortgage History
| Date | Status | Borrower | Loan Amount |
|---|---|---|---|
| Open | Velasquez Stephanie L | $216,900 | |
| Previous Owner | Ernst Mark | $180,000 |
Source: Public Records
Tax History Compared to Growth
Tax History
| Year | Tax Paid | Tax Assessment Tax Assessment Total Assessment is a certain percentage of the fair market value that is determined by local assessors to be the total taxable value of land and additions on the property. | Land | Improvement |
|---|---|---|---|---|
| 2024 | $3,842 | $219,317 | -- | -- |
| 2023 | $3,700 | $212,929 | $0 | $0 |
| 2022 | $3,506 | $206,727 | $0 | $0 |
| 2021 | $3,437 | $200,706 | $0 | $0 |
| 2020 | $3,347 | $197,935 | $0 | $0 |
| 2019 | $3,242 | $193,485 | $0 | $0 |
| 2018 | $3,088 | $189,877 | $0 | $0 |
| 2017 | $3,043 | $219,741 | $0 | $0 |
| 2016 | $3,004 | $182,147 | $0 | $0 |
| 2015 | $3,036 | $180,881 | $0 | $0 |
| 2014 | $3,813 | $179,801 | $0 | $0 |
| 2013 | -- | $163,538 | $0 | $0 |
Source: Public Records
Map
Nearby Homes
- 2321 Carroll Grove Dr
- 1719 W Overpar Dr
- 1711 W Followthru Dr
- 11331 N Oakleaf Ave
- 1706 W Fore Dr
- 10235 N Fleetwood Dr
- 11505 N Rome Ave
- 10310 Carroll Cove Place
- 10702 N Oregon Ave
- 10306 Fore Dr
- 10504 Lacera Dr
- 10908 W Elbow Dr
- 1213 Cuttingin Place
- 12008 N Oregon Ave
- 12002 Hope Ln
- 2510 Lake Ellen Dr
- 10305 Orange Grove Dr
- 2509 Lake Ellen Dr
- 12219 Armenia Gables Cir Unit 12219
- 1422 W Bogie Dr
- 2111 S Fore Cir
- 2103 S Fore Cir
- 2108 W Fore Dr
- 2110 W Fore Dr
- 2106 W Fore Dr
- 2113 S Fore Cir
- 2112 S Fore Cir
- 2110 S Fore Cir
- 2112 W Fore Dr
- 2104 S Fore Cir
- 2114 S Fore Cir
- 2102 S Fore Cir
- 2106 S Fore Cir
- 2108 S Fore Cir
- 2204 Shadehill Ct
- 2101 W Fore Dr
- 2109 W Fore Dr
- 2206 Shadehill Ct
- 2111 W Fore Dr
- 2105 W Fore Dr