Estimated Value: $211,000 - $331,000
3
Beds
2
Baths
1,948
Sq Ft
$139/Sq Ft
Est. Value
About This Home
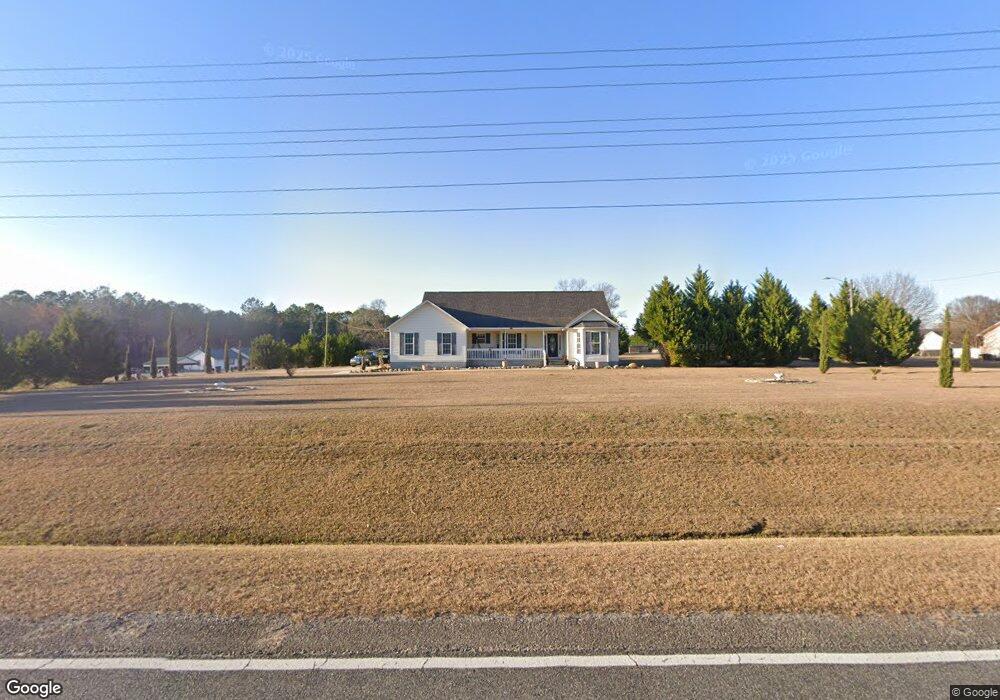
This home is located at 2109 Sawmill NE, Ailey, GA 30410 and is currently estimated at $271,732, approximately $139 per square foot. 2109 Sawmill NE is a home located in Montgomery County with nearby schools including Montgomery County Elementary School, Montgomery County Middle School, and Montgomery County High School.
Ownership History
Date
Name
Owned For
Owner Type
Purchase Details
Closed on
Oct 10, 2012
Sold by
Brandon Waters Llc
Bought by
Stanley Jackie L
Current Estimated Value
Home Financials for this Owner
Home Financials are based on the most recent Mortgage that was taken out on this home.
Original Mortgage
$129,500
Outstanding Balance
$88,774
Interest Rate
3.6%
Mortgage Type
VA
Estimated Equity
$182,958
Purchase Details
Closed on
Mar 21, 2012
Sold by
Bank Of New York Mellon
Bought by
Brandon Waters Llc
Purchase Details
Closed on
Apr 5, 2011
Sold by
Wolfe Rebecca
Bought by
Bank Of New York Mellon
Purchase Details
Closed on
Apr 10, 2003
Sold by
Parrish Capital Reso
Bought by
Wolfe Rebecca
Purchase Details
Closed on
Jul 24, 2001
Sold by
Raffield Steve A
Bought by
Parrish Capital Reso
Purchase Details
Closed on
Jun 5, 2000
Sold by
Parrish Development
Bought by
Raffield Steve A
Create a Home Valuation Report for This Property
The Home Valuation Report is an in-depth analysis detailing your home's value as well as a comparison with similar homes in the area
Purchase History
| Date | Buyer | Sale Price | Title Company |
|---|---|---|---|
| Stanley Jackie L | $129,500 | -- | |
| Brandon Waters Llc | $47,500 | -- | |
| Brandon Waters Llc | $47,500 | -- | |
| Bank Of New York Mellon | $95,500 | -- | |
| Wolfe Rebecca | $148,000 | -- | |
| Parrish Capital Reso | -- | -- | |
| Raffield Steve A | $8,500 | -- |
Source: Public Records
Mortgage History
| Date | Status | Borrower | Loan Amount |
|---|---|---|---|
| Open | Stanley Jackie L | $129,500 |
Source: Public Records
Tax History
| Year | Tax Paid | Tax Assessment Tax Assessment Total Assessment is a certain percentage of the fair market value that is determined by local assessors to be the total taxable value of land and additions on the property. | Land | Improvement |
|---|---|---|---|---|
| 2025 | -- | $60,868 | $3,800 | $57,068 |
| 2024 | -- | $60,868 | $3,800 | $57,068 |
| 2023 | $0 | $60,868 | $3,800 | $57,068 |
| 2022 | $1,647 | $60,868 | $3,800 | $57,068 |
| 2021 | $1,647 | $60,868 | $3,800 | $57,068 |
| 2020 | $1,454 | $53,740 | $3,800 | $49,940 |
| 2019 | $1,454 | $53,740 | $3,800 | $49,940 |
| 2018 | $1,454 | $53,740 | $3,800 | $49,940 |
| 2017 | $1,454 | $53,740 | $3,800 | $49,940 |
| 2016 | $1,444 | $53,344 | $3,800 | $49,544 |
| 2015 | -- | $53,344 | $3,800 | $49,544 |
| 2014 | -- | $53,344 | $3,800 | $49,544 |
Source: Public Records
Map
Nearby Homes
- 585 Old Savannah Rd
- 2731 Saw Mill Rd
- 1501 Old Savannah Rd
- 1400 1400 Lakewood Dr
- 0000 Foxfire Dr
- 198 Foxfire Dr
- 956 Joe Hilton Rd
- 709 Bob Sharpe Rd
- 2003 Chevy Place
- 195 Old Savannah Rd
- 109 Fairway Dr
- 168 Timberloch Dr
- LOT 61 AND TRAC Lakewood Dr
- 190 Richland Ct
- 231 Sandspur Ln
- 113 Central Dr
- 0 Chesley Dr Unit 23818
- 818 Miracle Ln
- 1902 Lance Ct
- 815 Mcallister Dr
- 2109 Sawmill Rd
- 2115 Sawmill Rd
- 110 Ashley Wilkes Dr
- 2101 Sawmill Rd
- 111 Ashley Wilkes Dr
- 120 Ashley Wilkes Dr
- 115 Tara Dr
- 119 Tara Dr
- 130 Ashley Wilkes Dr
- 1 Ashley Wilkes Dr
- 1901 Sawmill Rd
- 2080 Sawmill Rd
- 120 Tara Dr
- 2123 Saw Mill Rd
- 2123 Sawmill Rd
- 2092 Saw Mill Rd
- 125 Tara Dr
- 140 Ashley Wilkes Dr
- 1900 Sawmill Rd
- 2135 Sawmill Rd
Your Personal Tour Guide
Ask me questions while you tour the home.