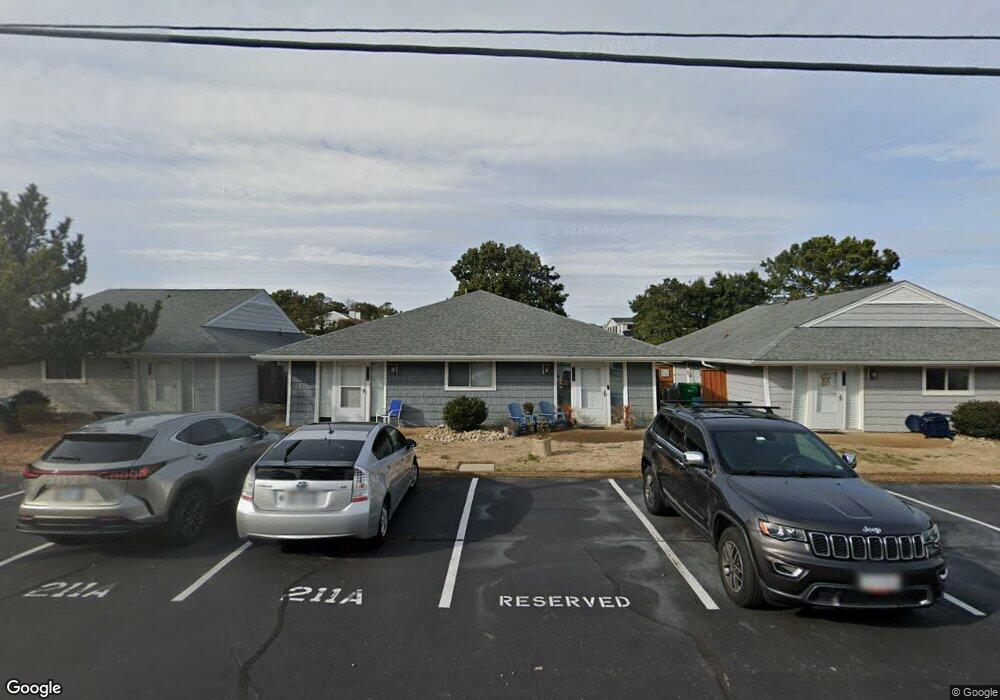
211 56th St Unit C Virginia Beach, VA 23451
North End NeighborhoodEstimated Value: $434,000 - $479,000
2
Beds
2
Baths
874
Sq Ft
$515/Sq Ft
Est. Value
About This Home
This home is located at 211 56th St Unit C, Virginia Beach, VA 23451 and is currently estimated at $449,812, approximately $514 per square foot. 211 56th St Unit C is a home located in Virginia Beach City with nearby schools including Linkhorn Park Elementary School, Virginia Beach Middle School, and Frank W. Cox High School.
Ownership History
Date
Name
Owned For
Owner Type
Purchase Details
Closed on
Oct 10, 2023
Sold by
Dunn Mark
Bought by
Marcart Kevin D and Allard Christyn
Current Estimated Value
Purchase Details
Closed on
Jul 2, 2019
Sold by
Cann Lawrence B
Bought by
Dunn Mark
Purchase Details
Closed on
Dec 9, 2004
Sold by
Cann Brian M
Bought by
Cann Lawrence B
Home Financials for this Owner
Home Financials are based on the most recent Mortgage that was taken out on this home.
Original Mortgage
$203,300
Interest Rate
5.77%
Mortgage Type
New Conventional
Purchase Details
Closed on
Mar 8, 2002
Sold by
Atlantic Ave Dev L L C
Bought by
Smith Stephen
Home Financials for this Owner
Home Financials are based on the most recent Mortgage that was taken out on this home.
Original Mortgage
$103,000
Interest Rate
7.01%
Mortgage Type
New Conventional
Create a Home Valuation Report for This Property
The Home Valuation Report is an in-depth analysis detailing your home's value as well as a comparison with similar homes in the area
Home Values in the Area
Average Home Value in this Area
Purchase History
| Date | Buyer | Sale Price | Title Company |
|---|---|---|---|
| Marcart Kevin D | $387,500 | Fidelity National Title | |
| Dunn Mark | $260,000 | Priority Title & Escrow Llc | |
| Cann Lawrence B | $250,000 | -- | |
| Smith Stephen | $103,000 | -- |
Source: Public Records
Mortgage History
| Date | Status | Borrower | Loan Amount |
|---|---|---|---|
| Previous Owner | Cann Lawrence B | $203,300 | |
| Previous Owner | Smith Stephen | $103,000 |
Source: Public Records
Tax History Compared to Growth
Tax History
| Year | Tax Paid | Tax Assessment Tax Assessment Total Assessment is a certain percentage of the fair market value that is determined by local assessors to be the total taxable value of land and additions on the property. | Land | Improvement |
|---|---|---|---|---|
| 2025 | $3,664 | $392,000 | $275,000 | $117,000 |
| 2024 | $3,664 | $377,700 | $220,000 | $157,700 |
| 2023 | $3,739 | $377,700 | $220,000 | $157,700 |
| 2022 | $3,346 | $338,000 | $200,000 | $138,000 |
| 2021 | $2,715 | $274,200 | $178,200 | $96,000 |
| 2020 | $2,526 | $248,300 | $162,000 | $86,300 |
| 2019 | $2,400 | $211,200 | $157,300 | $53,900 |
| 2018 | $2,117 | $211,200 | $157,300 | $53,900 |
| 2017 | $2,117 | $211,200 | $157,300 | $53,900 |
| 2016 | $2,069 | $209,000 | $157,300 | $51,700 |
| 2015 | $2,039 | $206,000 | $157,300 | $48,700 |
| 2014 | $1,755 | $206,100 | $148,000 | $58,100 |
Source: Public Records
Map
Nearby Homes
- 5604 Holly Rd Unit B
- 302 55th St Unit B
- 5503 Dawson Rd
- 5722 Dawson Rd
- 436 Gosnold Ct
- 300 Bay Colony Dr
- 219 64th St
- 228 66th St
- 213 66th St Unit B
- 6604 Atlantic Ave
- 6606 Atlantic Ave
- 125 67th St
- 557 Susan Constant Dr
- 506 Cavalier Dr
- 304 Cavalier Dr
- 1005 Ditchley Rd
- 1116 Rose Ln
- 6904 Ocean Front Ave
- 209 Glenn Miller St
- 4004 Atlantic Ave Unit 707
- 211 56th St Unit 13A
- 211 56th St Unit D
- 211 56th St Unit 13B
- 213 56th St Unit C
- 213 56th St Unit D
- 213 56th St Unit B
- 209 56th St Unit C
- 209 56th St Unit D
- 209 56th St Unit A
- 207 56th St Unit C
- 207 56th St Unit D
- 207 56th St Unit 9B
- 207 56th St
- 207 56th St Unit B
- 215 56th St Unit D
- 215 56th St Unit C
- 215 56th St Unit A
- 217 56th St Unit A
- 217 56th St Unit B
- 210 57th St Unit 5D