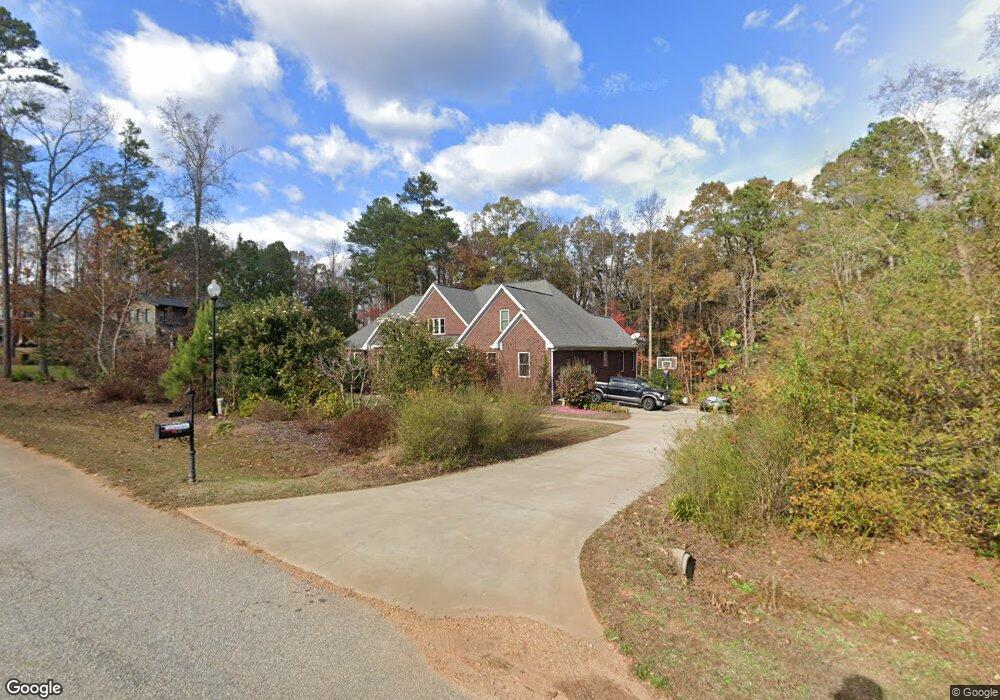
211 Alamo Ct Unit 110 Clayton, NC 27527
Wilders NeighborhoodEstimated Value: $743,000 - $839,444
4
Beds
4
Baths
3,471
Sq Ft
$224/Sq Ft
Est. Value
About This Home
This home is located at 211 Alamo Ct Unit 110, Clayton, NC 27527 and is currently estimated at $779,148, approximately $224 per square foot. 211 Alamo Ct Unit 110 is a home located in Johnston County with nearby schools including Archer Lodge Middle School, Corinth Holders High School, and Thales Academy at Flowers Plantation PreK-7.
Ownership History
Date
Name
Owned For
Owner Type
Purchase Details
Closed on
Aug 5, 2021
Sold by
Rose Robert A and Rose Renee U
Bought by
Dunn Ken Scott and Roycroft Linda Marie
Current Estimated Value
Home Financials for this Owner
Home Financials are based on the most recent Mortgage that was taken out on this home.
Original Mortgage
$525,000
Outstanding Balance
$478,099
Interest Rate
3%
Mortgage Type
New Conventional
Estimated Equity
$301,049
Purchase Details
Closed on
Mar 16, 2017
Sold by
Vilak Robert E and Vilak Pauline
Bought by
Vilak Robert E and Cochran Karen L
Home Financials for this Owner
Home Financials are based on the most recent Mortgage that was taken out on this home.
Original Mortgage
$309,000
Interest Rate
4.19%
Mortgage Type
New Conventional
Purchase Details
Closed on
Mar 14, 2012
Sold by
Dream Land Builders Inc
Bought by
Rose Robert A and Renee U Rose C
Create a Home Valuation Report for This Property
The Home Valuation Report is an in-depth analysis detailing your home's value as well as a comparison with similar homes in the area
Home Values in the Area
Average Home Value in this Area
Purchase History
| Date | Buyer | Sale Price | Title Company |
|---|---|---|---|
| Dunn Ken Scott | $665,000 | None Available | |
| Vilak Robert E | -- | -- | |
| Rose Robert A | $99,000 | None Available |
Source: Public Records
Mortgage History
| Date | Status | Borrower | Loan Amount |
|---|---|---|---|
| Open | Dunn Ken Scott | $525,000 | |
| Previous Owner | Vilak Robert E | $309,000 |
Source: Public Records
Tax History Compared to Growth
Tax History
| Year | Tax Paid | Tax Assessment Tax Assessment Total Assessment is a certain percentage of the fair market value that is determined by local assessors to be the total taxable value of land and additions on the property. | Land | Improvement |
|---|---|---|---|---|
| 2025 | $6,406 | $1,008,810 | $312,500 | $696,310 |
| 2024 | $4,579 | $565,270 | $105,000 | $460,270 |
| 2023 | $4,579 | $565,270 | $105,000 | $460,270 |
| 2022 | $4,635 | $565,270 | $105,000 | $460,270 |
| 2021 | $3,686 | $449,500 | $63,000 | $386,500 |
| 2020 | $3,821 | $449,500 | $63,000 | $386,500 |
| 2019 | $3,821 | $449,500 | $63,000 | $386,500 |
| 2018 | $3,488 | $400,960 | $55,210 | $345,750 |
| 2017 | $3,488 | $400,960 | $55,210 | $345,750 |
| 2016 | $3,488 | $400,960 | $55,210 | $345,750 |
| 2015 | $1,426 | $400,960 | $55,210 | $345,750 |
| 2014 | $1,426 | $163,910 | $33,310 | $130,600 |
Source: Public Records
Map
Nearby Homes
- 33 White Ash Dr
- 82 White Ash Dr
- 60 Brodie Cedar Way
- 479 Whitley Ridge Dr
- 39 Hanging Moss Trail
- 421 Mallard Loop Dr
- 555 Whitley Ridge Dr
- 53 Whitley Ridge Dr
- 88 Antler Steel Dr
- 99 Still Hand Dr
- Seneca Plan at South Lake Townes at Flowers Plantation
- Seine Plan at South Lake Townes at Flowers Plantation
- 181 N District Ave Unit 286
- 170 District Ave Unit 264
- 73 Lighthaven Ln
- 27 Batten Hill Ln
- 115 Chase Dr
- 196 N District Ave Unit 269
- 196-269 N District Ave
- 170 N District Ave Unit 264
- 211 Alamo Ct
- 212 Alamo Ct Unit 114
- 212 Alamo Ct
- 169 Alamo Ct Unit 108
- 169 Alamo Ct
- 160 Alamo Ct
- 160 Alamo Ct Unit 115
- 149 Alamo Ct
- 149 Alamo Ct
- 149 Alamo Ct Unit 107
- 149 Alamo Ct
- 131 Alamo Ct Unit 106
- 131 Alamo Ct
- 95 Fort Boone Ct
- 0 Alamo Ct Unit 1946809
- 83 Alamo Ct
- 115 Alamo Ct
- 245 Alamo Ct
- 108 Alamo Ct
- 183 Alamo Ct