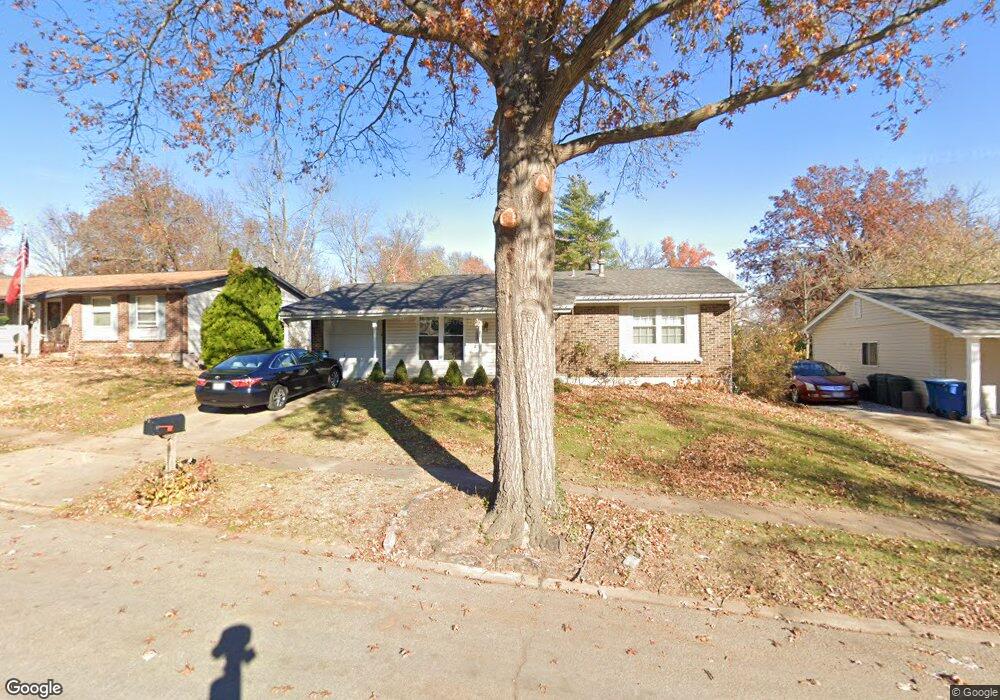
211 Bitterwood Dr Ballwin, MO 63021
Estimated Value: $313,776 - $353,000
3
Beds
2
Baths
1,321
Sq Ft
$255/Sq Ft
Est. Value
About This Home
This home is located at 211 Bitterwood Dr, Ballwin, MO 63021 and is currently estimated at $337,194, approximately $255 per square foot. 211 Bitterwood Dr is a home located in St. Louis County with nearby schools including Woerther Elementary School, Selvidge Middle School, and Marquette Sr. High School.
Ownership History
Date
Name
Owned For
Owner Type
Purchase Details
Closed on
Aug 17, 2010
Sold by
Yeargain Rebecca K and Yeargain Mark
Bought by
Yeargain Rebecca K and Yeargain Mark
Current Estimated Value
Home Financials for this Owner
Home Financials are based on the most recent Mortgage that was taken out on this home.
Original Mortgage
$198,750
Outstanding Balance
$132,781
Interest Rate
4.75%
Mortgage Type
FHA
Estimated Equity
$204,413
Purchase Details
Closed on
Aug 28, 2009
Sold by
Yeargain Rebecca and Finley Rebecca K
Bought by
Yeargain Rebecca
Home Financials for this Owner
Home Financials are based on the most recent Mortgage that was taken out on this home.
Original Mortgage
$196,224
Interest Rate
5.06%
Mortgage Type
FHA
Purchase Details
Closed on
May 2, 2006
Sold by
Plantation Properties Llc
Bought by
Finley Rebecca K
Home Financials for this Owner
Home Financials are based on the most recent Mortgage that was taken out on this home.
Original Mortgage
$148,000
Interest Rate
6.4%
Mortgage Type
Fannie Mae Freddie Mac
Create a Home Valuation Report for This Property
The Home Valuation Report is an in-depth analysis detailing your home's value as well as a comparison with similar homes in the area
Home Values in the Area
Average Home Value in this Area
Purchase History
| Date | Buyer | Sale Price | Title Company |
|---|---|---|---|
| Yeargain Rebecca K | -- | Tri | |
| Yeargain Rebecca | -- | Old Republic Title | |
| Finley Rebecca K | $185,000 | None Available |
Source: Public Records
Mortgage History
| Date | Status | Borrower | Loan Amount |
|---|---|---|---|
| Open | Yeargain Rebecca K | $198,750 | |
| Closed | Yeargain Rebecca | $196,224 | |
| Closed | Finley Rebecca K | $148,000 |
Source: Public Records
Tax History Compared to Growth
Tax History
| Year | Tax Paid | Tax Assessment Tax Assessment Total Assessment is a certain percentage of the fair market value that is determined by local assessors to be the total taxable value of land and additions on the property. | Land | Improvement |
|---|---|---|---|---|
| 2025 | $3,470 | $55,590 | $27,910 | $27,680 |
| 2024 | $3,470 | $49,500 | $21,720 | $27,780 |
| 2023 | $3,467 | $49,500 | $21,720 | $27,780 |
| 2022 | $3,185 | $42,200 | $18,620 | $23,580 |
| 2021 | $3,161 | $42,200 | $18,620 | $23,580 |
| 2020 | $3,029 | $38,530 | $15,500 | $23,030 |
| 2019 | $3,041 | $38,530 | $15,500 | $23,030 |
| 2018 | $2,760 | $32,950 | $11,630 | $21,320 |
| 2017 | $2,695 | $32,950 | $11,630 | $21,320 |
| 2016 | $2,534 | $29,770 | $9,310 | $20,460 |
| 2015 | $2,483 | $29,770 | $9,310 | $20,460 |
| 2014 | $2,432 | $28,440 | $6,190 | $22,250 |
Source: Public Records
Map
Nearby Homes
- 480 Coachgate Ct
- 681 Twigwood Dr
- 642 Old Ballwin Rd
- 587 Twigwood Dr
- 673 Towerwood Dr
- 229 Victor Ct
- 277 Ramsey Ln
- 370 Marywood Ct
- 220 Newton Place
- 607 Rustic Valley Dr
- 611 Parker Dr
- 729 Redstart Dr
- 818 Reinke Rd
- 801 Reinke Rd
- 738 Village Wood Ct
- 231 Ries Rd Unit A
- 682 Rustic Valley Dr
- 489 Westglen Village Dr
- 151 Holly Garden Dr
- 110 Coral Terrace Unit 6
- 207 Bitterwood Dr
- 215 Bitterwood Dr
- 594 Golfwood Dr
- 217 Bitterwood Dr
- 304 Statewood Dr
- 598 Golfwood Dr
- 208 Bitterwood Dr
- 592 Golfwood Dr
- 210 Bitterwood Dr
- 206 Bitterwood Dr
- 588 Golfwood Dr
- 212 Bitterwood Dr
- 204 Bitterwood Dr
- 221 Bitterwood Dr
- 214 Bitterwood Dr
- 306 Statewood Dr
- 586 Golfwood Dr
- 529 Blazedwood Dr
- 597 Golfwood Dr
- 531 Blazedwood Dr