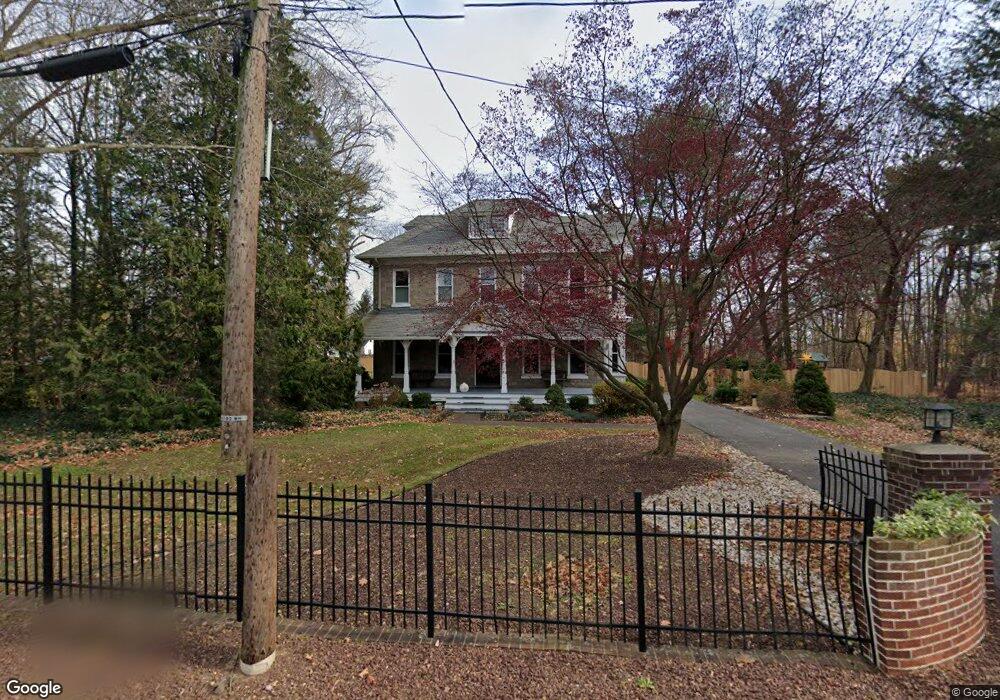
211 Bridge St Rancocas, NJ 08073
Estimated Value: $391,000 - $733,000
--
Bed
--
Bath
3,442
Sq Ft
$181/Sq Ft
Est. Value
About This Home
This home is located at 211 Bridge St, Rancocas, NJ 08073 and is currently estimated at $622,670, approximately $180 per square foot. 211 Bridge St is a home with nearby schools including Holly Hills Elementary School, Westampton Intermediate School, and Rancocas Valley Regional High School.
Ownership History
Date
Name
Owned For
Owner Type
Purchase Details
Closed on
Nov 30, 2007
Sold by
Alleva Arthur A and Alleva Paula H
Bought by
Howard John L and Howard Katherina A
Current Estimated Value
Home Financials for this Owner
Home Financials are based on the most recent Mortgage that was taken out on this home.
Original Mortgage
$122,900
Outstanding Balance
$78,551
Interest Rate
6.49%
Mortgage Type
Unknown
Estimated Equity
$544,119
Create a Home Valuation Report for This Property
The Home Valuation Report is an in-depth analysis detailing your home's value as well as a comparison with similar homes in the area
Home Values in the Area
Average Home Value in this Area
Purchase History
| Date | Buyer | Sale Price | Title Company |
|---|---|---|---|
| Howard John L | $599,900 | None Available |
Source: Public Records
Mortgage History
| Date | Status | Borrower | Loan Amount |
|---|---|---|---|
| Open | Howard John L | $122,900 | |
| Open | Howard John L | $417,000 |
Source: Public Records
Tax History Compared to Growth
Tax History
| Year | Tax Paid | Tax Assessment Tax Assessment Total Assessment is a certain percentage of the fair market value that is determined by local assessors to be the total taxable value of land and additions on the property. | Land | Improvement |
|---|---|---|---|---|
| 2025 | $10,270 | $365,600 | $92,200 | $273,400 |
| 2024 | $9,882 | $365,600 | $92,200 | $273,400 |
| 2023 | $9,882 | $365,600 | $92,200 | $273,400 |
| 2022 | $9,317 | $362,800 | $92,200 | $270,600 |
| 2021 | $8,972 | $362,800 | $92,200 | $270,600 |
| 2020 | $8,936 | $362,800 | $92,200 | $270,600 |
| 2019 | $8,754 | $362,800 | $92,200 | $270,600 |
| 2018 | $8,642 | $362,800 | $92,200 | $270,600 |
| 2017 | $8,413 | $362,800 | $92,200 | $270,600 |
| 2016 | $8,257 | $362,800 | $92,200 | $270,600 |
| 2015 | $8,098 | $362,800 | $92,200 | $270,600 |
| 2014 | $7,891 | $362,800 | $92,200 | $270,600 |
Source: Public Records
Map
Nearby Homes