Estimated Value: $385,000 - $407,691
3
Beds
2
Baths
1,976
Sq Ft
$202/Sq Ft
Est. Value
About This Home
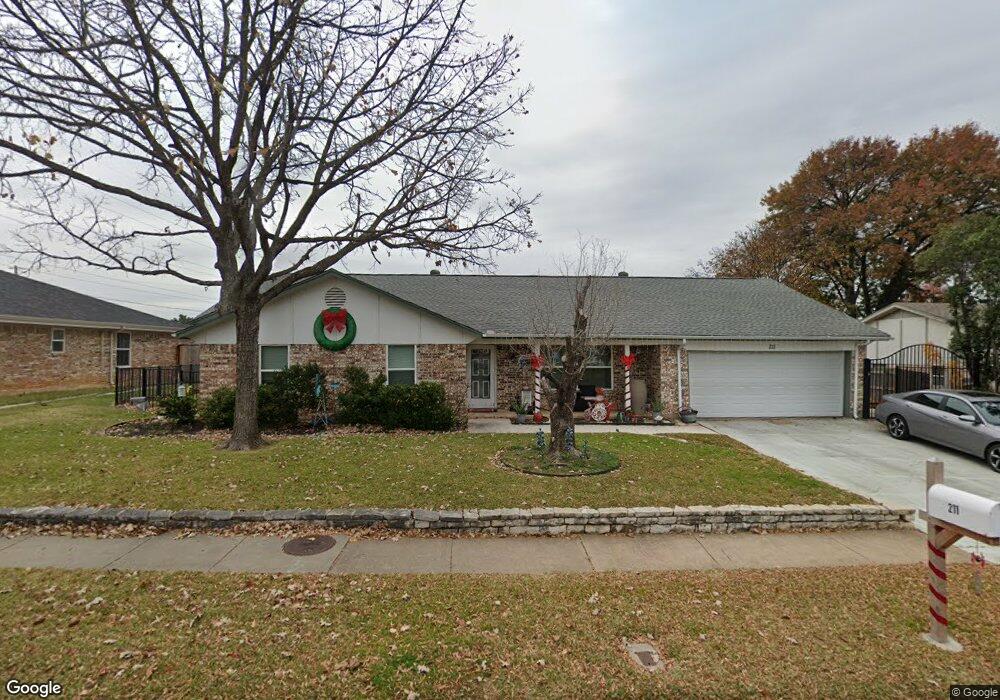
This home is located at 211 Carolyn Dr, Hurst, TX 76054 and is currently estimated at $399,173, approximately $202 per square foot. 211 Carolyn Dr is a home located in Tarrant County with nearby schools including Bedford Heights Elementary School, Bedford Junior High School, and L.D. Bell High School.
Ownership History
Date
Name
Owned For
Owner Type
Purchase Details
Closed on
Jul 30, 2018
Sold by
Davis Daniel S
Bought by
Devis Daniel S
Current Estimated Value
Home Financials for this Owner
Home Financials are based on the most recent Mortgage that was taken out on this home.
Original Mortgage
$186,000
Outstanding Balance
$138,130
Interest Rate
4.5%
Mortgage Type
Stand Alone First
Estimated Equity
$261,043
Purchase Details
Closed on
Jun 15, 2005
Sold by
Churchman Mark L and Churchman Julie
Bought by
Davis Daniel S
Home Financials for this Owner
Home Financials are based on the most recent Mortgage that was taken out on this home.
Original Mortgage
$117,120
Interest Rate
5.75%
Mortgage Type
Purchase Money Mortgage
Create a Home Valuation Report for This Property
The Home Valuation Report is an in-depth analysis detailing your home's value as well as a comparison with similar homes in the area
Home Values in the Area
Average Home Value in this Area
Purchase History
| Date | Buyer | Sale Price | Title Company |
|---|---|---|---|
| Devis Daniel S | -- | Texas American Title Co | |
| Davis Daniel S | -- | American Title |
Source: Public Records
Mortgage History
| Date | Status | Borrower | Loan Amount |
|---|---|---|---|
| Open | Devis Daniel S | $186,000 | |
| Previous Owner | Davis Daniel S | $117,120 |
Source: Public Records
Tax History Compared to Growth
Tax History
| Year | Tax Paid | Tax Assessment Tax Assessment Total Assessment is a certain percentage of the fair market value that is determined by local assessors to be the total taxable value of land and additions on the property. | Land | Improvement |
|---|---|---|---|---|
| 2025 | $6,078 | $383,778 | $75,000 | $308,778 |
| 2024 | $6,078 | $383,778 | $75,000 | $308,778 |
| 2023 | $7,163 | $386,655 | $55,000 | $331,655 |
| 2022 | $7,484 | $335,705 | $55,000 | $280,705 |
| 2021 | $7,127 | $303,258 | $55,000 | $248,258 |
| 2020 | $6,463 | $278,383 | $55,000 | $223,383 |
| 2019 | $5,977 | $289,496 | $55,000 | $234,496 |
| 2018 | $4,794 | $222,011 | $55,000 | $167,011 |
| 2017 | $5,107 | $222,532 | $18,000 | $204,532 |
| 2016 | $4,643 | $209,864 | $18,000 | $191,864 |
| 2015 | $3,897 | $166,800 | $18,000 | $148,800 |
| 2014 | $3,897 | $166,800 | $18,000 | $148,800 |
Source: Public Records
Map
Nearby Homes
- 432 Sunnybrook Ct
- 320 Blue Quail Ct
- 121 Kay Ct
- 421 Cavender Ct
- 124 Jeannie Ct
- 1732 Jeannie Ln
- 305 Warbler Dr
- 2212 Mountainview Dr
- 404 Heather Ln
- 440 W Louella Dr
- 2212 Hurstview Dr
- 2244 Hurstview Dr
- 100 Hillview Ct
- 1740 Brown Trail
- 817 Shady Lake Dr
- 405 Woodbriar Ct
- 3213 Spring Valley Dr
- 2436 Brookgreen Ct
- 3119 Spring Grove Dr
- 520 Baker Dr
- 215 Carolyn Dr
- 214 Mountainview Dr
- 212 Mountainview Dr
- 210 Mountainview Dr
- 210 Mountainview Dr
- 216 Mountainview Dr
- 218 Mountainview Dr
- 2020 Northglen Dr
- 219 Carolyn Dr
- 207 Carolyn Dr
- 220 Mountainview Dr
- 2021 Northglen Dr
- 208 Mountainview Dr
- 222 Mountainview Dr
- 2024 Northglen Dr
- 224 Mountainview Dr
- 223 Carolyn Dr
- 205 Carolyn Dr
- 206 Mountain View Dr
- 2025 Northglen Dr