Estimated Value: $373,600 - $419,000
4
Beds
2
Baths
2,231
Sq Ft
$179/Sq Ft
Est. Value
About This Home
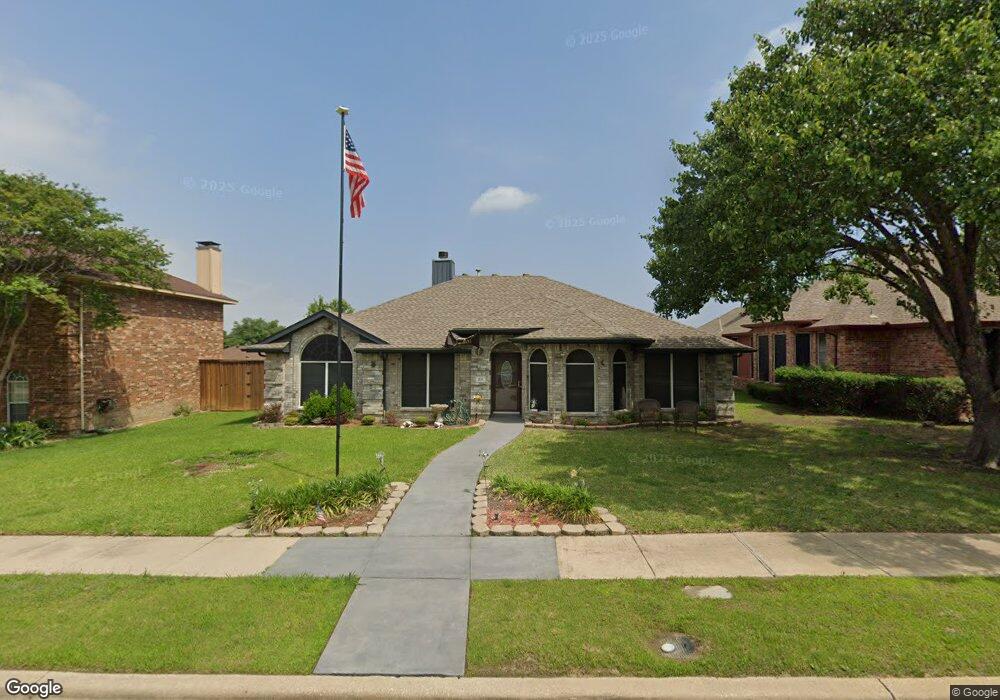
This home is located at 211 Cedar Ridge St, Wylie, TX 75098 and is currently estimated at $399,150, approximately $178 per square foot. 211 Cedar Ridge St is a home located in Collin County with nearby schools including P M Akin Elementary School, AB Harrison Intermediate School, and Grady Burnett J High School.
Ownership History
Date
Name
Owned For
Owner Type
Purchase Details
Closed on
Dec 3, 2001
Sold by
Biesma Dennis A and Biesma Dennis Alan
Bought by
Castillo Daniel A and Castillo Brenda
Current Estimated Value
Home Financials for this Owner
Home Financials are based on the most recent Mortgage that was taken out on this home.
Original Mortgage
$142,500
Outstanding Balance
$71,925
Interest Rate
10.62%
Estimated Equity
$327,225
Purchase Details
Closed on
Jun 18, 1999
Sold by
Biesma Carla Evelyn
Bought by
Biesma Dennis Alan
Purchase Details
Closed on
Jun 30, 1998
Sold by
D R Horton Texas Ltd
Bought by
Biesma Dennis A and Biesma Carla E
Home Financials for this Owner
Home Financials are based on the most recent Mortgage that was taken out on this home.
Original Mortgage
$94,185
Interest Rate
7.08%
Create a Home Valuation Report for This Property
The Home Valuation Report is an in-depth analysis detailing your home's value as well as a comparison with similar homes in the area
Home Values in the Area
Average Home Value in this Area
Purchase History
| Date | Buyer | Sale Price | Title Company |
|---|---|---|---|
| Castillo Daniel A | -- | Reunion Title Co | |
| Biesma Dennis Alan | -- | -- | |
| Biesma Dennis A | -- | Drh Title |
Source: Public Records
Mortgage History
| Date | Status | Borrower | Loan Amount |
|---|---|---|---|
| Open | Castillo Daniel A | $142,500 | |
| Previous Owner | Biesma Dennis A | $94,185 | |
| Closed | Biesma Dennis Alan | $0 |
Source: Public Records
Tax History Compared to Growth
Tax History
| Year | Tax Paid | Tax Assessment Tax Assessment Total Assessment is a certain percentage of the fair market value that is determined by local assessors to be the total taxable value of land and additions on the property. | Land | Improvement |
|---|---|---|---|---|
| 2025 | $5,743 | $368,463 | $100,000 | $268,463 |
| 2024 | $5,743 | $361,571 | $100,000 | $275,895 |
| 2023 | $5,743 | $328,701 | $100,000 | $269,981 |
| 2022 | $6,556 | $298,819 | $80,000 | $232,048 |
| 2021 | $6,392 | $271,654 | $70,000 | $201,654 |
| 2020 | $6,335 | $255,151 | $55,000 | $200,151 |
| 2019 | $6,620 | $251,900 | $55,000 | $213,623 |
| 2018 | $6,167 | $229,000 | $55,000 | $174,000 |
| 2017 | $5,671 | $234,429 | $45,000 | $189,429 |
| 2016 | $5,319 | $191,430 | $35,000 | $156,430 |
| 2015 | $4,334 | $176,527 | $35,000 | $141,527 |
Source: Public Records
Map
Nearby Homes
- 216 Cedar Ridge St
- 820 Foxwood Ln
- 825 Foxwood Ln
- 104 Rushcreek Dr
- 811 Forest Edge Ln
- 825 Forest Edge Ln
- 409 Cedar Ridge Dr
- 306 Woodhollow Ct
- 300 Woodhollow Ct
- 416 Dogwood Dr
- 114 Liberty Dr
- 104 N 5th St
- 304 Hawthorn Dr
- 306 Foxwood Ct
- 207 Spence Dr
- 327 S 4th St
- 414 Briarwood Dr
- 301 S 3rd St
- 310 Hawthorn Dr
- 1209 Surrey Cir
- 213 Cedar Ridge St
- 209 Cedar Ridge St
- 207 Cedar Ridge St
- 215 Cedar Ridge St
- 206 Tanglewood Dr
- 204 Tanglewood Dr
- 208 Tanglewood Dr
- 212 Cedar Ridge St
- 210 Cedar Ridge St
- 202 Tanglewood Dr
- 205 Cedar Ridge Dr
- 205 Cedar Ridge St
- 214 Cedar Ridge St
- 210 Tanglewood Dr
- 208 Cedar Ridge St
- 214 Cedar Ridge Dr
- 206 Cedar Ridge St
- 200 Tanglewood Dr
- 203 Cedar Ridge St
- 301 Cedar Ridge St