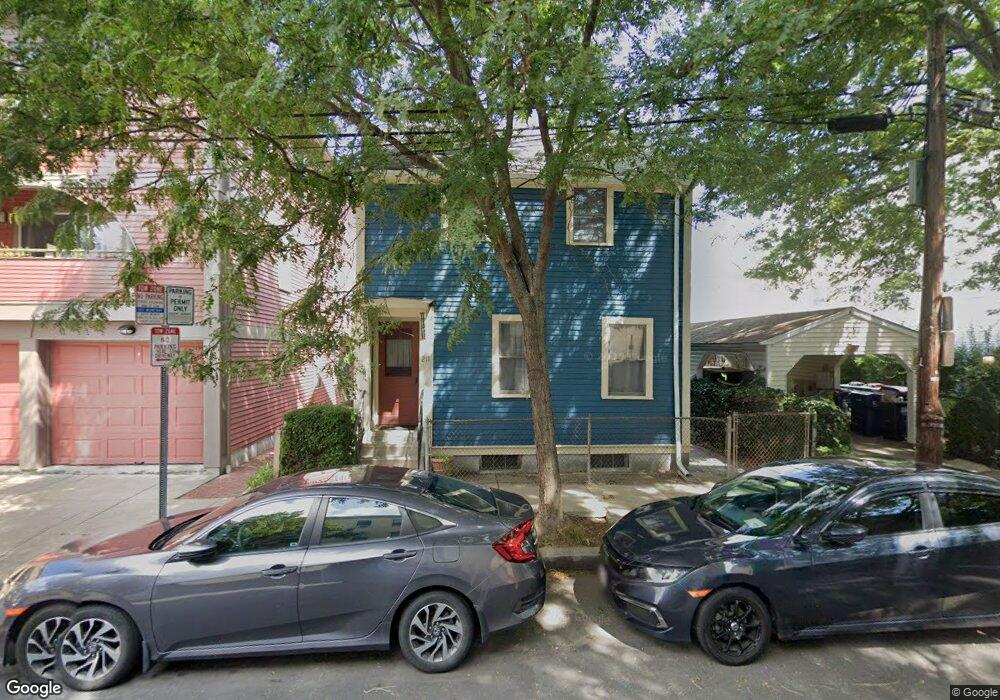
211 Charles St Cambridge, MA 02141
East Cambridge NeighborhoodEstimated Value: $1,067,000 - $1,235,703
3
Beds
2
Baths
1,144
Sq Ft
$1,007/Sq Ft
Est. Value
About This Home
This home is located at 211 Charles St, Cambridge, MA 02141 and is currently estimated at $1,151,676, approximately $1,006 per square foot. 211 Charles St is a home located in Middlesex County with nearby schools including Community Charter School of Cambridge, Boston Children's School, and Torit Montessori School.
Ownership History
Date
Name
Owned For
Owner Type
Purchase Details
Closed on
Nov 25, 1994
Sold by
Est Weber Gertrude and Carceo Cathleen M
Bought by
Keplin Paul J and Massie Rhonda
Current Estimated Value
Home Financials for this Owner
Home Financials are based on the most recent Mortgage that was taken out on this home.
Original Mortgage
$109,250
Interest Rate
8.91%
Mortgage Type
Purchase Money Mortgage
Create a Home Valuation Report for This Property
The Home Valuation Report is an in-depth analysis detailing your home's value as well as a comparison with similar homes in the area
Home Values in the Area
Average Home Value in this Area
Purchase History
| Date | Buyer | Sale Price | Title Company |
|---|---|---|---|
| Keplin Paul J | $115,000 | -- |
Source: Public Records
Mortgage History
| Date | Status | Borrower | Loan Amount |
|---|---|---|---|
| Open | Keplin Paul J | $60,000 | |
| Open | Keplin Paul J | $110,000 | |
| Closed | Keplin Paul J | $109,000 | |
| Closed | Keplin Paul J | $109,250 |
Source: Public Records
Tax History
| Year | Tax Paid | Tax Assessment Tax Assessment Total Assessment is a certain percentage of the fair market value that is determined by local assessors to be the total taxable value of land and additions on the property. | Land | Improvement |
|---|---|---|---|---|
| 2025 | $6,400 | $1,007,800 | $692,900 | $314,900 |
| 2024 | $6,114 | $1,032,700 | $731,200 | $301,500 |
| 2023 | $5,616 | $958,400 | $698,100 | $260,300 |
| 2022 | $5,232 | $922,600 | $692,200 | $230,400 |
| 2021 | $64 | $894,400 | $679,200 | $215,200 |
| 2020 | $5,115 | $889,600 | $685,600 | $204,000 |
| 2019 | $9,555 | $857,000 | $672,500 | $184,500 |
| 2018 | $59 | $727,900 | $557,700 | $170,200 |
| 2017 | $4,287 | $660,600 | $498,600 | $162,000 |
| 2016 | $3,815 | $545,800 | $390,400 | $155,400 |
| 2015 | $3,703 | $473,500 | $334,600 | $138,900 |
| 2014 | $3,321 | $396,300 | $259,200 | $137,100 |
Source: Public Records
Map
Nearby Homes
- 96 Otis St Unit 1
- 76-78 Thorndike St
- 59 7th St
- 59 7th St Unit 2
- 59 7th St Unit 1
- 59 7th St Unit 3
- 25 6th St
- 47-53R 8th St
- 78 Otis St
- 50 Spring St
- 1 Marney St
- 68 Gore St
- 25 Marney St
- 30 2nd St Unit B
- 30 2nd St Unit A
- 30
- 747 Cambridge St Unit 7
- 747 Cambridge St Unit 2
- 747 Cambridge St Unit 4
- 747 Cambridge St Unit 6
- 221 Charles St Unit 3
- 221 Charles St Unit 2
- 221 Charles St Unit 1
- 221 Charles St Unit 1,1
- 209 Charles St
- 223 Charles St Unit 1
- 223 Charles St
- 207 Charles St
- 207 Charles St Unit 3
- 316 Hurley St
- 316 Hurley St Unit 2
- 157 5th St
- 205 Charles St
- 205 Charles St Unit 1
- 205 Charles St Unit 3
- 205 Charles St Unit 2
- 205 1/2 Charles St Unit 2
- 225 Charles St Unit 1
- 225 Charles St Unit 2
- 225 Charles St
Your Personal Tour Guide
Ask me questions while you tour the home.